Birlacable 500060 full analysis,charts,indicators,moving averages,SMA,DMA,EMA,ADX,MACD,RSIBirlacable 500060 WideScreen charts, DMA,SMA,EMA technical analysis, forecast prediction, by indicators ADX,MACD,RSI,CCI BSE stock exchange
Daily price and charts and targets Birlacable Strong Daily Stock price targets for Birlacable 500060 are 152.75 and 157.75 | Daily Target 1 | 151.58 | | Daily Target 2 | 153.92 | | Daily Target 3 | 156.58333333333 | | Daily Target 4 | 158.92 | | Daily Target 5 | 161.58 |
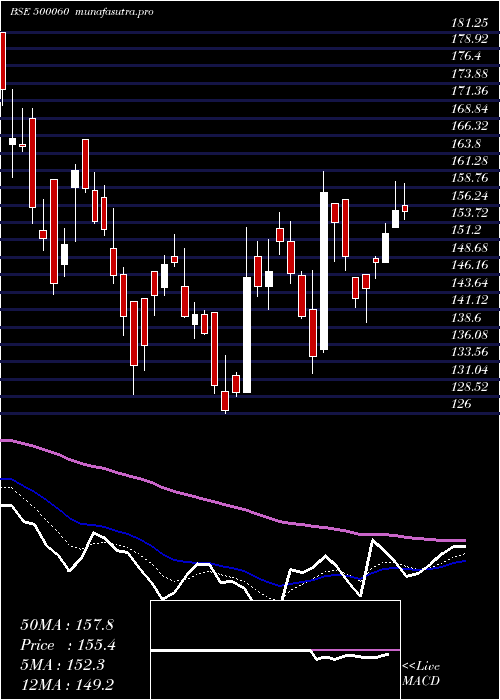
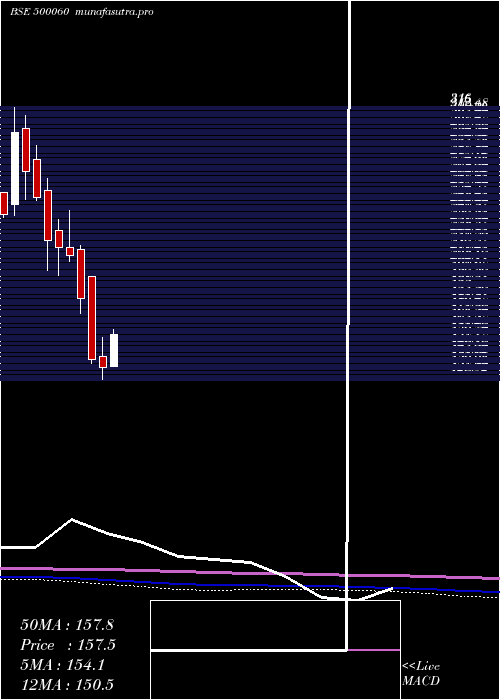
Daily price and volume Birlacable
| Date |
Closing |
Open |
Range |
Volume |
Tue 21 October 2025 |
156.25 (0.51%) |
158.70 |
154.25 - 159.25 |
0.0676 times |
Mon 20 October 2025 |
155.45 (0.55%) |
154.60 |
154.25 - 157.70 |
0.8188 times |
Fri 17 October 2025 |
154.60 (-0.67%) |
155.65 |
154.00 - 157.55 |
0.6461 times |
Thu 16 October 2025 |
155.65 (-2.63%) |
159.50 |
155.45 - 159.50 |
1.1484 times |
Wed 15 October 2025 |
159.85 (3.3%) |
154.50 |
154.30 - 160.60 |
0.5038 times |
Tue 14 October 2025 |
154.75 (-1.15%) |
162.90 |
153.50 - 166.00 |
1.2984 times |
Mon 13 October 2025 |
156.55 (-0.98%) |
156.10 |
155.50 - 156.90 |
0.9447 times |
Fri 10 October 2025 |
158.10 (0.64%) |
159.25 |
157.90 - 160.00 |
0.508 times |
Thu 09 October 2025 |
157.10 (-0.88%) |
159.00 |
155.00 - 160.00 |
1.5175 times |
Wed 08 October 2025 |
158.50 (-1.83%) |
162.85 |
157.10 - 162.85 |
2.5466 times |
Tue 07 October 2025 |
161.45 (-2.45%) |
172.00 |
158.30 - 172.00 |
1.8306 times |
Weekly price and charts Birlacable Strong weekly Stock price targets for Birlacable 500060 are 155.25 and 160.25 | Weekly Target 1 | 151.58 | | Weekly Target 2 | 153.92 | | Weekly Target 3 | 156.58333333333 | | Weekly Target 4 | 158.92 | | Weekly Target 5 | 161.58 |
Weekly price and volumes for Birlacable
| Date |
Closing |
Open |
Range |
Volume |
Tue 21 October 2025 |
156.25 (1.07%) |
154.60 |
154.25 - 159.25 |
0.157 times |
Fri 17 October 2025 |
154.60 (-2.21%) |
156.10 |
153.50 - 166.00 |
0.8042 times |
Fri 10 October 2025 |
158.10 (-2.23%) |
162.70 |
155.00 - 172.00 |
1.3166 times |
Fri 03 October 2025 |
161.70 (3.32%) |
159.25 |
153.20 - 164.90 |
0.7967 times |
Fri 26 September 2025 |
156.50 (-9.56%) |
178.90 |
155.75 - 178.90 |
2.7383 times |
Fri 19 September 2025 |
173.05 (5.01%) |
169.00 |
160.05 - 174.40 |
1.9668 times |
Fri 12 September 2025 |
164.80 (4.2%) |
158.10 |
157.00 - 166.00 |
0.7977 times |
Fri 05 September 2025 |
158.15 (0.86%) |
155.20 |
155.20 - 160.00 |
0.6001 times |
Fri 29 August 2025 |
156.80 (-2.61%) |
161.00 |
154.45 - 163.00 |
0.3045 times |
Fri 22 August 2025 |
161.00 (5.78%) |
152.95 |
152.00 - 163.85 |
0.5181 times |
Thu 14 August 2025 |
152.20 (-9.16%) |
163.65 |
151.55 - 169.80 |
0.7854 times |

Monthly price and charts Birlacable Strong monthly Stock price targets for Birlacable 500060 are 154.73 and 173.53 | Monthly Target 1 | 141.68 | | Monthly Target 2 | 148.97 | | Monthly Target 3 | 160.48333333333 | | Monthly Target 4 | 167.77 | | Monthly Target 5 | 179.28 |
Monthly price and volumes Birlacable
| Date |
Closing |
Open |
Range |
Volume |
Tue 21 October 2025 |
156.25 (-1.39%) |
153.20 |
153.20 - 172.00 |
0.2354 times |
Tue 30 September 2025 |
158.45 (1.05%) |
155.20 |
155.20 - 178.90 |
0.5992 times |
Fri 29 August 2025 |
156.80 (-7.22%) |
170.00 |
151.55 - 172.20 |
0.2127 times |
Thu 31 July 2025 |
169.00 (-7.22%) |
182.00 |
165.10 - 183.00 |
0.2739 times |
Mon 30 June 2025 |
182.15 (-0.19%) |
179.50 |
174.65 - 215.00 |
3.5598 times |
Fri 30 May 2025 |
182.50 (23.14%) |
148.30 |
132.05 - 201.65 |
1.6282 times |
Wed 30 April 2025 |
148.20 (10.39%) |
135.35 |
134.90 - 166.00 |
1.536 times |
Fri 28 March 2025 |
134.25 (-4.21%) |
142.25 |
126.00 - 155.20 |
1.056 times |
Fri 28 February 2025 |
140.15 (-23.1%) |
198.05 |
137.35 - 198.05 |
0.4206 times |
Fri 31 January 2025 |
182.25 (-14.15%) |
217.00 |
172.00 - 219.75 |
0.4781 times |
Tue 31 December 2024 |
212.30 (-2.73%) |
218.35 |
208.10 - 243.90 |
0.4482 times |
DMA SMA EMA moving averages of Birlacable 500060
DMA (daily moving average) of Birlacable 500060
| DMA period | DMA value | | 5 day DMA | 156.36 | | 12 day DMA | 157.81 | | 20 day DMA | 159.82 | | 35 day DMA | 161.85 | | 50 day DMA | 160.99 | | 100 day DMA | 170.07 | | 150 day DMA | 164.36 | | 200 day DMA | 168.89 | EMA (exponential moving average) of Birlacable 500060
| EMA period | EMA current | EMA prev | EMA prev2 | | 5 day EMA | 156.12 | 156.06 | 156.36 | | 12 day EMA | 157.62 | 157.87 | 158.31 | | 20 day EMA | 159.1 | 159.4 | 159.82 | | 35 day EMA | 160.01 | 160.23 | 160.51 | | 50 day EMA | 161.14 | 161.34 | 161.58 |
SMA (simple moving average) of Birlacable 500060
| SMA period | SMA current | SMA prev | SMA prev2 | | 5 day SMA | 156.36 | 156.06 | 156.28 | | 12 day SMA | 157.81 | 158.27 | 158.75 | | 20 day SMA | 159.82 | 160.62 | 161.5 | | 35 day SMA | 161.85 | 161.85 | 161.89 | | 50 day SMA | 160.99 | 161.22 | 161.47 | | 100 day SMA | 170.07 | 170.35 | 170.67 | | 150 day SMA | 164.36 | 164.27 | 164.14 | | 200 day SMA | 168.89 | 169.19 | 169.49 |
|
|
