BiharSponge 500058 full analysis,charts,indicators,moving averages,SMA,DMA,EMA,ADX,MACD,RSIBihar Sponge 500058 WideScreen charts, DMA,SMA,EMA technical analysis, forecast prediction, by indicators ADX,MACD,RSI,CCI BSE stock exchange
Daily price and charts and targets BiharSponge Strong Daily Stock price targets for BiharSponge 500058 are 12.39 and 13.27 | Daily Target 1 | 12.17 | | Daily Target 2 | 12.6 | | Daily Target 3 | 13.05 | | Daily Target 4 | 13.48 | | Daily Target 5 | 13.93 |
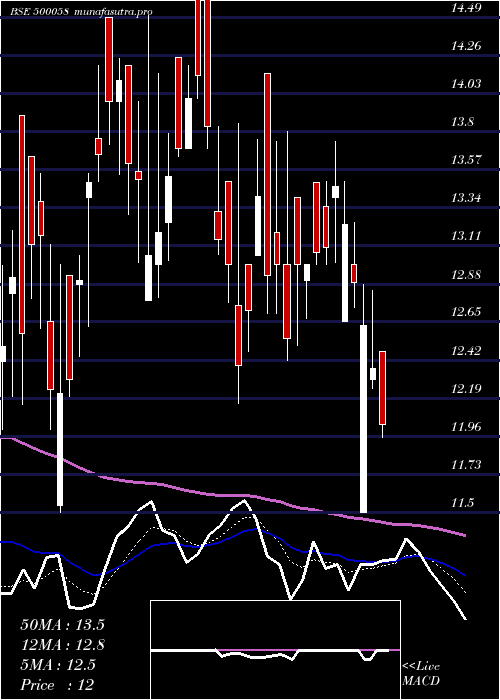
Daily price and volume Bihar Sponge
| Date |
Closing |
Open |
Range |
Volume |
Thu 23 October 2025 |
13.03 (-0.61%) |
13.11 |
12.62 - 13.50 |
0.7434 times |
Tue 21 October 2025 |
13.11 (5.47%) |
12.27 |
12.27 - 13.40 |
1.715 times |
Mon 20 October 2025 |
12.43 (1.97%) |
12.69 |
12.28 - 13.27 |
1.0396 times |
Fri 17 October 2025 |
12.19 (-0.16%) |
12.20 |
12.01 - 12.65 |
0.3 times |
Thu 16 October 2025 |
12.21 (-2.32%) |
12.40 |
12.02 - 12.69 |
0.4847 times |
Wed 15 October 2025 |
12.50 (1.79%) |
12.28 |
11.72 - 12.69 |
1.0927 times |
Tue 14 October 2025 |
12.28 (-0.32%) |
12.32 |
12.00 - 12.87 |
0.534 times |
Mon 13 October 2025 |
12.32 (-2.76%) |
12.40 |
12.08 - 12.40 |
0.6568 times |
Fri 10 October 2025 |
12.67 (-0.24%) |
12.90 |
12.07 - 12.90 |
3.0354 times |
Thu 09 October 2025 |
12.70 (-0.55%) |
12.77 |
12.40 - 12.98 |
0.3984 times |
Wed 08 October 2025 |
12.77 (2.49%) |
12.50 |
12.00 - 12.78 |
1.2661 times |
Weekly price and charts BiharSponge Strong weekly Stock price targets for BiharSponge 500058 are 12.65 and 13.88 | Weekly Target 1 | 11.7 | | Weekly Target 2 | 12.37 | | Weekly Target 3 | 12.933333333333 | | Weekly Target 4 | 13.6 | | Weekly Target 5 | 14.16 |
Weekly price and volumes for Bihar Sponge
| Date |
Closing |
Open |
Range |
Volume |
Thu 23 October 2025 |
13.03 (6.89%) |
12.69 |
12.27 - 13.50 |
0.89 times |
Fri 17 October 2025 |
12.19 (-3.79%) |
12.40 |
11.72 - 12.87 |
0.7807 times |
Fri 10 October 2025 |
12.67 (1.36%) |
12.50 |
12.00 - 12.98 |
1.3139 times |
Fri 03 October 2025 |
12.50 (-1.03%) |
12.30 |
12.16 - 13.19 |
1.1262 times |
Fri 26 September 2025 |
12.63 (-3.07%) |
13.00 |
12.40 - 13.50 |
1.4106 times |
Fri 19 September 2025 |
13.03 (-2.83%) |
13.41 |
12.93 - 14.01 |
1.4897 times |
Fri 12 September 2025 |
13.41 (0.37%) |
13.08 |
13.08 - 14.27 |
0.866 times |
Fri 05 September 2025 |
13.36 (-0.37%) |
13.41 |
12.95 - 13.99 |
1.1755 times |
Fri 29 August 2025 |
13.41 (-4.89%) |
13.85 |
13.20 - 14.70 |
0.3874 times |
Fri 22 August 2025 |
14.10 (-4.21%) |
14.72 |
14.00 - 14.97 |
0.5599 times |
Thu 14 August 2025 |
14.72 (4.92%) |
14.33 |
13.72 - 15.17 |
0.8589 times |
Monthly price and charts BiharSponge Strong monthly Stock price targets for BiharSponge 500058 are 12.38 and 14.16 | Monthly Target 1 | 10.97 | | Monthly Target 2 | 12 | | Monthly Target 3 | 12.75 | | Monthly Target 4 | 13.78 | | Monthly Target 5 | 14.53 |
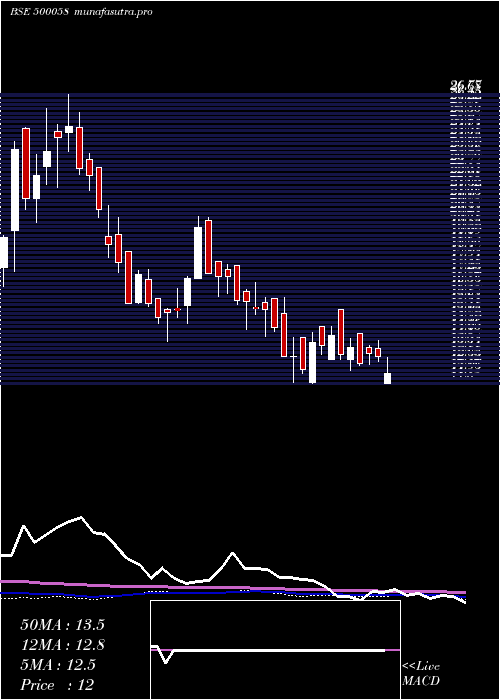
Monthly price and volumes Bihar Sponge
| Date |
Closing |
Open |
Range |
Volume |
Thu 23 October 2025 |
13.03 (1.8%) |
12.74 |
11.72 - 13.50 |
0.4786 times |
Tue 30 September 2025 |
12.80 (-4.55%) |
13.41 |
12.25 - 14.27 |
0.6938 times |
Fri 29 August 2025 |
13.41 (-10.6%) |
15.59 |
13.20 - 15.59 |
0.4131 times |
Thu 31 July 2025 |
15.00 (-2.85%) |
16.25 |
14.85 - 19.65 |
2.0404 times |
Mon 30 June 2025 |
15.44 (13.86%) |
13.56 |
12.00 - 17.40 |
1.9892 times |
Fri 30 May 2025 |
13.56 (12.72%) |
12.15 |
10.20 - 14.00 |
0.7096 times |
Wed 30 April 2025 |
12.03 (-7.46%) |
12.75 |
11.50 - 14.15 |
0.7511 times |
Fri 28 March 2025 |
13.00 (6.21%) |
11.54 |
11.50 - 15.40 |
1.1552 times |
Fri 28 February 2025 |
12.24 (-20.42%) |
15.99 |
11.55 - 16.04 |
0.8657 times |
Fri 31 January 2025 |
15.38 (-8.23%) |
16.99 |
13.96 - 17.79 |
0.9033 times |
Tue 31 December 2024 |
16.76 (8.97%) |
15.59 |
14.65 - 20.30 |
2.7003 times |

DMA SMA EMA moving averages of Bihar Sponge 500058
DMA (daily moving average) of Bihar Sponge 500058
| DMA period | DMA value | | 5 day DMA | 12.59 | | 12 day DMA | 12.56 | | 20 day DMA | 12.62 | | 35 day DMA | 12.98 | | 50 day DMA | 13.32 | | 100 day DMA | 14.29 | | 150 day DMA | 13.78 | | 200 day DMA | 14.04 | EMA (exponential moving average) of Bihar Sponge 500058
| EMA period | EMA current | EMA prev | EMA prev2 | | 5 day EMA | 12.75 | 12.61 | 12.36 | | 12 day EMA | 12.65 | 12.58 | 12.48 | | 20 day EMA | 12.73 | 12.7 | 12.66 | | 35 day EMA | 13.01 | 13.01 | 13 | | 50 day EMA | 13.33 | 13.34 | 13.35 |
SMA (simple moving average) of Bihar Sponge 500058
| SMA period | SMA current | SMA prev | SMA prev2 | | 5 day SMA | 12.59 | 12.49 | 12.32 | | 12 day SMA | 12.56 | 12.52 | 12.47 | | 20 day SMA | 12.62 | 12.61 | 12.6 | | 35 day SMA | 12.98 | 13 | 13.01 | | 50 day SMA | 13.32 | 13.34 | 13.36 | | 100 day SMA | 14.29 | 14.28 | 14.27 | | 150 day SMA | 13.78 | 13.79 | 13.79 | | 200 day SMA | 14.04 | 14.06 | 14.08 |
|
|
