BasfIndia 500042 full analysis,charts,indicators,moving averages,SMA,DMA,EMA,ADX,MACD,RSIBasf India 500042 WideScreen charts, DMA,SMA,EMA technical analysis, forecast prediction, by indicators ADX,MACD,RSI,CCI BSE stock exchange
Daily price and charts and targets BasfIndia Strong Daily Stock price targets for BasfIndia 500042 are 4661.73 and 4725.93 | Daily Target 1 | 4609.75 | | Daily Target 2 | 4649.5 | | Daily Target 3 | 4673.95 | | Daily Target 4 | 4713.7 | | Daily Target 5 | 4738.15 |
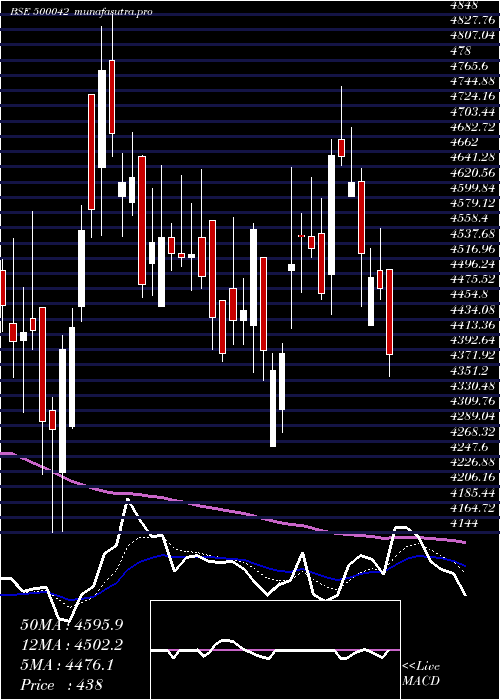
Daily price and volume Basf India
| Date |
Closing |
Open |
Range |
Volume |
Wed 03 September 2025 |
4689.25 (0.62%) |
4645.25 |
4634.20 - 4698.40 |
0.0391 times |
Tue 02 September 2025 |
4660.55 (0.69%) |
4666.55 |
4598.65 - 4686.80 |
0.0392 times |
Mon 01 September 2025 |
4628.70 (0.37%) |
4611.50 |
4599.20 - 4680.00 |
0.0622 times |
Fri 29 August 2025 |
4611.65 (1.29%) |
4553.00 |
4545.15 - 4744.60 |
0.3278 times |
Thu 28 August 2025 |
4553.00 (1.68%) |
4567.40 |
4399.55 - 4573.05 |
0.0934 times |
Tue 26 August 2025 |
4477.80 (-2.55%) |
4507.05 |
4460.00 - 4568.60 |
0.2079 times |
Mon 25 August 2025 |
4595.15 (-0.21%) |
4628.95 |
4555.00 - 4628.95 |
2.8059 times |
Fri 22 August 2025 |
4604.85 (0.3%) |
4636.95 |
4541.00 - 4645.00 |
0.1403 times |
Thu 21 August 2025 |
4591.00 (0.11%) |
4570.05 |
4547.85 - 4665.00 |
6.1803 times |
Wed 20 August 2025 |
4586.15 (1.31%) |
4574.90 |
4495.00 - 4596.95 |
0.1039 times |
Tue 19 August 2025 |
4526.90 (-0.34%) |
4599.95 |
4520.90 - 4599.95 |
0.0682 times |
Weekly price and charts BasfIndia Strong weekly Stock price targets for BasfIndia 500042 are 4643.95 and 4743.7 | Weekly Target 1 | 4562.35 | | Weekly Target 2 | 4625.8 | | Weekly Target 3 | 4662.1 | | Weekly Target 4 | 4725.55 | | Weekly Target 5 | 4761.85 |
Weekly price and volumes for Basf India
| Date |
Closing |
Open |
Range |
Volume |
Wed 03 September 2025 |
4689.25 (1.68%) |
4611.50 |
4598.65 - 4698.40 |
0.0874 times |
Fri 29 August 2025 |
4611.65 (0.15%) |
4628.95 |
4399.55 - 4744.60 |
2.1377 times |
Fri 22 August 2025 |
4604.85 (1.7%) |
4544.00 |
4495.00 - 4665.00 |
4.1153 times |
Thu 14 August 2025 |
4527.95 (0.42%) |
4509.00 |
4465.05 - 4665.00 |
0.242 times |
Fri 08 August 2025 |
4509.15 (-6.58%) |
4849.00 |
4480.00 - 4849.00 |
0.484 times |
Fri 01 August 2025 |
4826.95 (-4.37%) |
5030.05 |
4815.00 - 5199.00 |
0.7675 times |
Fri 25 July 2025 |
5047.65 (-0.28%) |
5080.00 |
4985.00 - 5200.00 |
0.5375 times |
Fri 18 July 2025 |
5061.90 (0.32%) |
5060.00 |
4925.95 - 5251.00 |
0.6818 times |
Fri 11 July 2025 |
5045.90 (-2.14%) |
5140.05 |
5022.50 - 5200.00 |
0.3766 times |
Fri 04 July 2025 |
5156.05 (0.98%) |
5101.05 |
5078.10 - 5242.50 |
0.5702 times |
Fri 27 June 2025 |
5106.25 (4.01%) |
4937.50 |
4867.85 - 5221.35 |
0.4724 times |

Monthly price and charts BasfIndia Strong monthly Stock price targets for BasfIndia 500042 are 4643.95 and 4743.7 | Monthly Target 1 | 4562.35 | | Monthly Target 2 | 4625.8 | | Monthly Target 3 | 4662.1 | | Monthly Target 4 | 4725.55 | | Monthly Target 5 | 4761.85 |
Monthly price and volumes Basf India
| Date |
Closing |
Open |
Range |
Volume |
Wed 03 September 2025 |
4689.25 (1.68%) |
4611.50 |
4598.65 - 4698.40 |
0.0218 times |
Fri 29 August 2025 |
4611.65 (-7.5%) |
4960.05 |
4399.55 - 4990.00 |
1.7572 times |
Thu 31 July 2025 |
4985.45 (-3.4%) |
5140.65 |
4850.00 - 5251.00 |
0.6955 times |
Mon 30 June 2025 |
5160.95 (-0.94%) |
5170.05 |
4867.85 - 5295.00 |
0.5489 times |
Fri 30 May 2025 |
5209.70 (18.78%) |
4350.50 |
4203.25 - 5418.20 |
1.6895 times |
Wed 30 April 2025 |
4386.10 (-1.03%) |
4431.60 |
4261.05 - 4750.00 |
0.3997 times |
Fri 28 March 2025 |
4431.60 (3.45%) |
4225.65 |
4145.65 - 4848.00 |
0.7022 times |
Fri 28 February 2025 |
4283.85 (-6.85%) |
4498.95 |
4076.75 - 4604.75 |
0.889 times |
Fri 31 January 2025 |
4598.90 (-17.55%) |
5580.05 |
4438.30 - 5639.95 |
1.029 times |
Tue 31 December 2024 |
5577.60 (-7.16%) |
5950.00 |
5419.75 - 5950.00 |
2.2672 times |
Fri 29 November 2024 |
6007.75 (-21.33%) |
7827.10 |
5500.00 - 8505.00 |
1.4094 times |

DMA SMA EMA moving averages of Basf India 500042
DMA (daily moving average) of Basf India 500042
| DMA period | DMA value | | 5 day DMA | 4628.63 | | 12 day DMA | 4588.96 | | 20 day DMA | 4591.03 | | 35 day DMA | 4768.19 | | 50 day DMA | 4867.65 | | 100 day DMA | 4828.47 | | 150 day DMA | 4718.79 | | 200 day DMA | 5009.8 | EMA (exponential moving average) of Basf India 500042
| EMA period | EMA current | EMA prev | EMA prev2 | | 5 day EMA | 4639.14 | 4614.09 | 4590.86 | | 12 day EMA | 4621.17 | 4608.8 | 4599.4 | | 20 day EMA | 4653.35 | 4649.57 | 4648.41 | | 35 day EMA | 4738.37 | 4741.26 | 4746.01 | | 50 day EMA | 4855.44 | 4862.22 | 4870.45 |
SMA (simple moving average) of Basf India 500042
| SMA period | SMA current | SMA prev | SMA prev2 | | 5 day SMA | 4628.63 | 4586.34 | 4573.26 | | 12 day SMA | 4588.96 | 4575.52 | 4570.82 | | 20 day SMA | 4591.03 | 4594.58 | 4602.9 | | 35 day SMA | 4768.19 | 4777.03 | 4788.04 | | 50 day SMA | 4867.65 | 4872.29 | 4877.26 | | 100 day SMA | 4828.47 | 4827.14 | 4824.98 | | 150 day SMA | 4718.79 | 4721.33 | 4723.8 | | 200 day SMA | 5009.8 | 5028.09 | 5046.33 |
|
|
