Atul 500027 full analysis,charts,indicators,moving averages,SMA,DMA,EMA,ADX,MACD,RSIAtul 500027 WideScreen charts, DMA,SMA,EMA technical analysis, forecast prediction, by indicators ADX,MACD,RSI,CCI BSE stock exchange
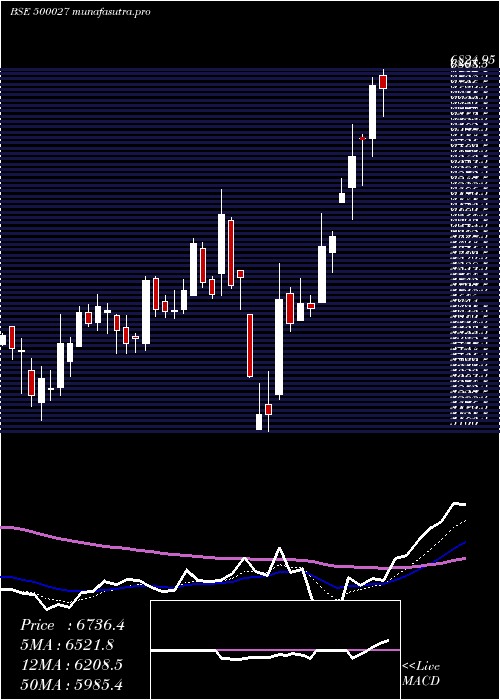
Daily price and charts and targets Atul Strong Daily Stock price targets for Atul 500027 are 5864.53 and 5965.93 | Daily Target 1 | 5843.25 | | Daily Target 2 | 5885.8 | | Daily Target 3 | 5944.65 | | Daily Target 4 | 5987.2 | | Daily Target 5 | 6046.05 |
Daily price and volume Atul
| Date |
Closing |
Open |
Range |
Volume |
Thu 23 October 2025 |
5928.35 (-1.19%) |
5980.05 |
5902.10 - 6003.50 |
0.5663 times |
Tue 21 October 2025 |
5999.90 (1.2%) |
5928.90 |
5861.35 - 6030.00 |
0.4969 times |
Mon 20 October 2025 |
5928.90 (0.2%) |
6004.40 |
5837.60 - 6039.05 |
0.4087 times |
Fri 17 October 2025 |
5916.95 (1.38%) |
5850.00 |
5839.65 - 6149.50 |
5.7503 times |
Thu 16 October 2025 |
5836.60 (1.2%) |
5767.70 |
5767.70 - 6030.00 |
1.5695 times |
Wed 15 October 2025 |
5767.65 (-0.96%) |
5805.50 |
5750.00 - 5835.90 |
0.3923 times |
Tue 14 October 2025 |
5823.35 (-2.69%) |
6030.00 |
5802.20 - 6030.00 |
0.341 times |
Mon 13 October 2025 |
5984.25 (-0.67%) |
5986.05 |
5973.95 - 6020.00 |
0.1769 times |
Fri 10 October 2025 |
6024.45 (0.73%) |
5997.00 |
5980.50 - 6066.90 |
0.1308 times |
Thu 09 October 2025 |
5980.50 (-0.36%) |
6025.95 |
5971.00 - 6027.00 |
0.1673 times |
Wed 08 October 2025 |
6002.20 (-1.46%) |
6098.00 |
5990.00 - 6100.00 |
0.2143 times |
Weekly price and charts Atul Strong weekly Stock price targets for Atul 500027 are 5782.25 and 5983.7 | Weekly Target 1 | 5733.55 | | Weekly Target 2 | 5830.95 | | Weekly Target 3 | 5935 | | Weekly Target 4 | 6032.4 | | Weekly Target 5 | 6136.45 |
Weekly price and volumes for Atul
| Date |
Closing |
Open |
Range |
Volume |
Thu 23 October 2025 |
5928.35 (0.19%) |
6004.40 |
5837.60 - 6039.05 |
0.3258 times |
Fri 17 October 2025 |
5916.95 (-1.78%) |
5986.05 |
5750.00 - 6149.50 |
1.822 times |
Fri 10 October 2025 |
6024.45 (-1.79%) |
6249.45 |
5971.00 - 6249.45 |
0.2492 times |
Fri 03 October 2025 |
6134.00 (1.59%) |
5950.15 |
5922.00 - 6200.30 |
0.3016 times |
Fri 26 September 2025 |
6038.05 (-4.85%) |
6340.50 |
6016.00 - 6340.50 |
0.3742 times |
Fri 19 September 2025 |
6345.50 (-0.84%) |
6351.55 |
6300.00 - 6589.00 |
0.4633 times |
Fri 12 September 2025 |
6399.05 (1.69%) |
6293.00 |
6232.85 - 6472.00 |
0.284 times |
Fri 05 September 2025 |
6292.75 (0.05%) |
6248.20 |
6248.00 - 6527.70 |
5.3912 times |
Fri 29 August 2025 |
6289.65 (-3.28%) |
6481.05 |
6216.95 - 6538.15 |
0.4732 times |
Fri 22 August 2025 |
6503.00 (2.44%) |
6469.95 |
6290.00 - 6574.75 |
0.3156 times |
Thu 14 August 2025 |
6348.15 (-4.22%) |
6646.95 |
6300.00 - 6663.40 |
0.2156 times |
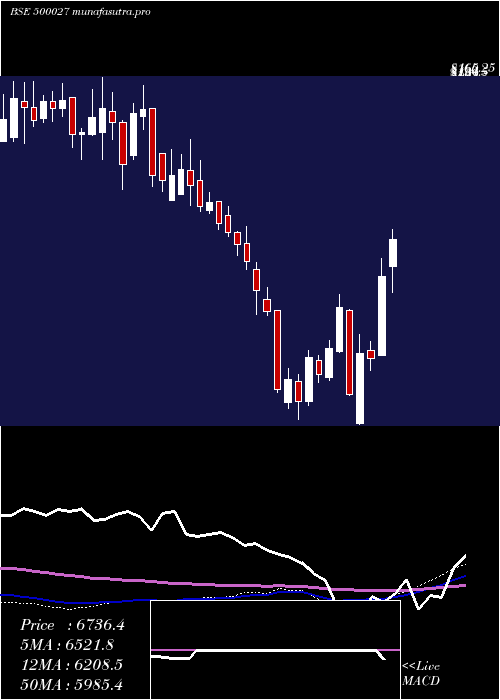
Monthly price and charts Atul Strong monthly Stock price targets for Atul 500027 are 5589.45 and 6088.9 | Monthly Target 1 | 5476.48 | | Monthly Target 2 | 5702.42 | | Monthly Target 3 | 5975.9333333333 | | Monthly Target 4 | 6201.87 | | Monthly Target 5 | 6475.38 |
Monthly price and volumes Atul
| Date |
Closing |
Open |
Range |
Volume |
Thu 23 October 2025 |
5928.35 (-2.1%) |
6100.00 |
5750.00 - 6249.45 |
0.5729 times |
Tue 30 September 2025 |
6055.40 (-3.72%) |
6248.20 |
5922.00 - 6589.00 |
1.537 times |
Fri 29 August 2025 |
6289.65 (-5.2%) |
6823.95 |
6216.95 - 6823.95 |
0.2927 times |
Thu 31 July 2025 |
6634.75 (-11.19%) |
7471.00 |
6480.00 - 7793.00 |
0.5159 times |
Mon 30 June 2025 |
7470.95 (4.85%) |
7156.00 |
6609.80 - 7532.15 |
0.4739 times |
Fri 30 May 2025 |
7125.35 (5.77%) |
6669.45 |
6509.10 - 7289.70 |
0.7333 times |
Wed 30 April 2025 |
6736.35 (9.83%) |
6104.75 |
5100.00 - 6824.95 |
3.1795 times |
Fri 28 March 2025 |
6133.55 (15.64%) |
5307.75 |
5271.85 - 6253.45 |
1.1588 times |
Fri 28 February 2025 |
5304.10 (-15.59%) |
6207.45 |
5151.00 - 6308.30 |
1.0859 times |
Fri 31 January 2025 |
6283.65 (-9.69%) |
6990.85 |
6075.05 - 7023.20 |
0.45 times |
Tue 31 December 2024 |
6957.60 (-4.66%) |
7135.05 |
6821.40 - 7617.30 |
0.3004 times |

DMA SMA EMA moving averages of Atul 500027
DMA (daily moving average) of Atul 500027
| DMA period | DMA value | | 5 day DMA | 5922.14 | | 12 day DMA | 5940.36 | | 20 day DMA | 6012.55 | | 35 day DMA | 6176.71 | | 50 day DMA | 6242.22 | | 100 day DMA | 6676.41 | | 150 day DMA | 6543.39 | | 200 day DMA | 6468.05 | EMA (exponential moving average) of Atul 500027
| EMA period | EMA current | EMA prev | EMA prev2 | | 5 day EMA | 5932.27 | 5934.23 | 5901.4 | | 12 day EMA | 5961.31 | 5967.3 | 5961.37 | | 20 day EMA | 6024.71 | 6034.85 | 6038.53 | | 35 day EMA | 6125.3 | 6136.89 | 6144.96 | | 50 day EMA | 6242.83 | 6255.66 | 6266.1 |
SMA (simple moving average) of Atul 500027
| SMA period | SMA current | SMA prev | SMA prev2 | | 5 day SMA | 5922.14 | 5890 | 5854.69 | | 12 day SMA | 5940.36 | 5950.75 | 5961.92 | | 20 day SMA | 6012.55 | 6029.14 | 6042.62 | | 35 day SMA | 6176.71 | 6189.25 | 6198.68 | | 50 day SMA | 6242.22 | 6256.21 | 6268.85 | | 100 day SMA | 6676.41 | 6687.97 | 6699.26 | | 150 day SMA | 6543.39 | 6541.32 | 6539.11 | | 200 day SMA | 6468.05 | 6473.66 | 6478.8 |
|
|
