ASarabhai 500009 full analysis,charts,indicators,moving averages,SMA,DMA,EMA,ADX,MACD,RSIA Sarabhai 500009 WideScreen charts, DMA,SMA,EMA technical analysis, forecast prediction, by indicators ADX,MACD,RSI,CCI BSE stock exchange
Daily price and charts and targets ASarabhai Strong Daily Stock price targets for ASarabhai 500009 are 32.78 and 34.17 | Daily Target 1 | 31.68 | | Daily Target 2 | 32.48 | | Daily Target 3 | 33.066666666667 | | Daily Target 4 | 33.87 | | Daily Target 5 | 34.46 |
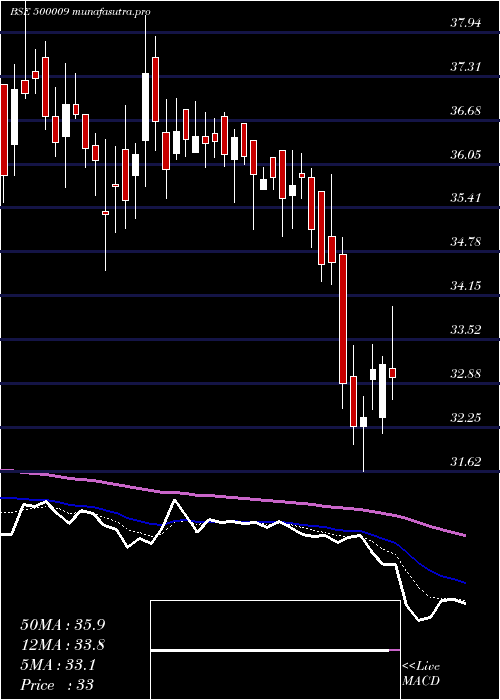
Daily price and volume A Sarabhai
| Date |
Closing |
Open |
Range |
Volume |
Tue 21 October 2025 |
33.29 (3.9%) |
33.28 |
32.26 - 33.65 |
0.6077 times |
Mon 20 October 2025 |
32.04 (0.19%) |
32.00 |
31.65 - 32.60 |
0.5914 times |
Fri 17 October 2025 |
31.98 (-3.5%) |
33.18 |
31.83 - 33.49 |
1.4358 times |
Thu 16 October 2025 |
33.14 (0.27%) |
33.11 |
33.00 - 33.74 |
0.5583 times |
Wed 15 October 2025 |
33.05 (0.03%) |
33.06 |
32.87 - 33.83 |
0.679 times |
Tue 14 October 2025 |
33.04 (-3.05%) |
34.49 |
32.80 - 34.49 |
1.546 times |
Mon 13 October 2025 |
34.08 (-3.57%) |
34.62 |
33.80 - 34.95 |
0.6152 times |
Fri 10 October 2025 |
35.34 (2.26%) |
34.50 |
34.20 - 35.50 |
0.9438 times |
Thu 09 October 2025 |
34.56 (-1.93%) |
35.49 |
33.05 - 35.90 |
1.7664 times |
Wed 08 October 2025 |
35.24 (-0.76%) |
35.40 |
35.00 - 36.17 |
1.2565 times |
Tue 07 October 2025 |
35.51 (-4.7%) |
37.49 |
34.99 - 38.50 |
5.4007 times |
Weekly price and charts ASarabhai Strong weekly Stock price targets for ASarabhai 500009 are 32.47 and 34.47 | Weekly Target 1 | 30.86 | | Weekly Target 2 | 32.08 | | Weekly Target 3 | 32.863333333333 | | Weekly Target 4 | 34.08 | | Weekly Target 5 | 34.86 |
Weekly price and volumes for A Sarabhai
| Date |
Closing |
Open |
Range |
Volume |
Tue 21 October 2025 |
33.29 (4.1%) |
32.00 |
31.65 - 33.65 |
0.1642 times |
Fri 17 October 2025 |
31.98 (-9.51%) |
34.62 |
31.83 - 34.95 |
0.6618 times |
Fri 10 October 2025 |
35.34 (3.79%) |
34.05 |
33.05 - 38.50 |
2.2087 times |
Fri 03 October 2025 |
34.05 (1.25%) |
33.63 |
31.50 - 34.80 |
1.1855 times |
Fri 26 September 2025 |
33.63 (9.58%) |
30.65 |
30.06 - 35.00 |
2.1733 times |
Fri 19 September 2025 |
30.69 (-2.6%) |
31.75 |
30.55 - 32.50 |
1.338 times |
Fri 12 September 2025 |
31.51 (-2.72%) |
32.45 |
31.10 - 33.25 |
0.5759 times |
Fri 05 September 2025 |
32.39 (3.15%) |
31.99 |
30.65 - 34.50 |
0.552 times |
Fri 29 August 2025 |
31.40 (-8.53%) |
34.74 |
30.75 - 34.90 |
0.4835 times |
Fri 22 August 2025 |
34.33 (1.48%) |
34.00 |
32.70 - 35.00 |
0.6571 times |
Thu 14 August 2025 |
33.83 (11.83%) |
30.40 |
30.10 - 35.85 |
1.2213 times |

Monthly price and charts ASarabhai Strong monthly Stock price targets for ASarabhai 500009 are 32.4 and 39.4 | Monthly Target 1 | 27.43 | | Monthly Target 2 | 30.36 | | Monthly Target 3 | 34.43 | | Monthly Target 4 | 37.36 | | Monthly Target 5 | 41.43 |
Monthly price and volumes A Sarabhai
| Date |
Closing |
Open |
Range |
Volume |
Tue 21 October 2025 |
33.29 (1.99%) |
32.64 |
31.50 - 38.50 |
0.6371 times |
Tue 30 September 2025 |
32.64 (3.95%) |
31.99 |
30.06 - 35.00 |
0.9715 times |
Fri 29 August 2025 |
31.40 (-5.31%) |
33.10 |
30.00 - 35.85 |
0.5923 times |
Thu 31 July 2025 |
33.16 (-9.55%) |
36.51 |
31.62 - 37.00 |
0.6336 times |
Mon 30 June 2025 |
36.66 (-3.2%) |
37.98 |
34.51 - 38.45 |
0.8055 times |
Fri 30 May 2025 |
37.87 (3.87%) |
36.47 |
34.21 - 40.44 |
0.6786 times |
Wed 30 April 2025 |
36.46 (4.02%) |
35.00 |
35.00 - 41.99 |
0.7281 times |
Fri 28 March 2025 |
35.05 (-10.95%) |
39.01 |
34.11 - 42.05 |
1.7501 times |
Fri 28 February 2025 |
39.36 (-20.26%) |
49.10 |
37.93 - 53.83 |
1.8702 times |
Fri 31 January 2025 |
49.36 (-7.88%) |
54.13 |
43.60 - 59.99 |
1.333 times |
Tue 31 December 2024 |
53.58 (-6.26%) |
57.00 |
52.75 - 68.00 |
1.7948 times |

DMA SMA EMA moving averages of A Sarabhai 500009
DMA (daily moving average) of A Sarabhai 500009
| DMA period | DMA value | | 5 day DMA | 32.7 | | 12 day DMA | 34.04 | | 20 day DMA | 33.55 | | 35 day DMA | 32.75 | | 50 day DMA | 32.7 | | 100 day DMA | 34.13 | | 150 day DMA | 35.23 | | 200 day DMA | 38.69 | EMA (exponential moving average) of A Sarabhai 500009
| EMA period | EMA current | EMA prev | EMA prev2 | | 5 day EMA | 32.9 | 32.71 | 33.04 | | 12 day EMA | 33.26 | 33.25 | 33.47 | | 20 day EMA | 33.24 | 33.23 | 33.35 | | 35 day EMA | 33.09 | 33.08 | 33.14 | | 50 day EMA | 32.65 | 32.62 | 32.64 |
SMA (simple moving average) of A Sarabhai 500009
| SMA period | SMA current | SMA prev | SMA prev2 | | 5 day SMA | 32.7 | 32.65 | 33.06 | | 12 day SMA | 34.04 | 34.11 | 34.14 | | 20 day SMA | 33.55 | 33.41 | 33.35 | | 35 day SMA | 32.75 | 32.69 | 32.67 | | 50 day SMA | 32.7 | 32.64 | 32.64 | | 100 day SMA | 34.13 | 34.18 | 34.25 | | 150 day SMA | 35.23 | 35.27 | 35.29 | | 200 day SMA | 38.69 | 38.81 | 38.93 |
|
|
