Abb 500002 full analysis,charts,indicators,moving averages,SMA,DMA,EMA,ADX,MACD,RSIAbb 500002 WideScreen charts, DMA,SMA,EMA technical analysis, forecast prediction, by indicators ADX,MACD,RSI,CCI BSE stock exchange
Daily price and charts and targets Abb Strong Daily Stock price targets for Abb 500002 are 5136.68 and 5180.68 | Daily Target 1 | 5125.12 | | Daily Target 2 | 5148.23 | | Daily Target 3 | 5169.1166666667 | | Daily Target 4 | 5192.23 | | Daily Target 5 | 5213.12 |
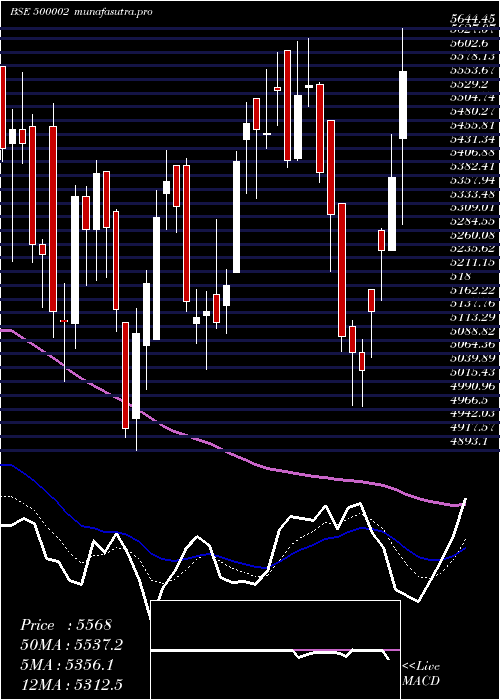
Daily price and volume Abb
| Date |
Closing |
Open |
Range |
Volume |
Fri 05 December 2025 |
5171.35 (0.02%) |
5189.20 |
5146.00 - 5190.00 |
0.4494 times |
Thu 04 December 2025 |
5170.55 (0.91%) |
5122.40 |
5095.00 - 5180.00 |
0.7041 times |
Wed 03 December 2025 |
5124.15 (-1.13%) |
5182.65 |
5088.50 - 5182.65 |
0.5221 times |
Tue 02 December 2025 |
5182.65 (-0.1%) |
5184.00 |
5158.65 - 5216.40 |
0.5749 times |
Mon 01 December 2025 |
5187.90 (0.3%) |
5239.80 |
5150.45 - 5239.80 |
0.7196 times |
Fri 28 November 2025 |
5172.60 (-1.32%) |
5242.30 |
5170.00 - 5263.60 |
1.5611 times |
Thu 27 November 2025 |
5241.60 (0.84%) |
5248.55 |
5188.05 - 5260.00 |
1.9079 times |
Wed 26 November 2025 |
5198.15 (2.73%) |
5060.10 |
5050.80 - 5204.20 |
1.2715 times |
Tue 25 November 2025 |
5060.05 (0.1%) |
5049.80 |
5037.55 - 5086.85 |
0.5028 times |
Mon 24 November 2025 |
5055.00 (-0.7%) |
5085.05 |
5029.50 - 5097.65 |
1.7866 times |
Fri 21 November 2025 |
5090.70 (-0.92%) |
5102.75 |
5070.00 - 5134.45 |
0.394 times |
Weekly price and charts Abb Strong weekly Stock price targets for Abb 500002 are 5054.28 and 5205.58 | Weekly Target 1 | 5015.25 | | Weekly Target 2 | 5093.3 | | Weekly Target 3 | 5166.55 | | Weekly Target 4 | 5244.6 | | Weekly Target 5 | 5317.85 |
Weekly price and volumes for Abb
| Date |
Closing |
Open |
Range |
Volume |
Fri 05 December 2025 |
5171.35 (-0.02%) |
5239.80 |
5088.50 - 5239.80 |
0.3586 times |
Fri 28 November 2025 |
5172.60 (1.61%) |
5085.05 |
5029.50 - 5263.60 |
0.8488 times |
Fri 21 November 2025 |
5090.70 (2.76%) |
4966.00 |
4950.00 - 5172.45 |
2.1769 times |
Fri 14 November 2025 |
4954.05 (-1.19%) |
4991.60 |
4896.00 - 5018.90 |
0.8516 times |
Fri 07 November 2025 |
5013.80 (-3.85%) |
5192.05 |
4964.00 - 5278.00 |
0.8586 times |
Fri 31 October 2025 |
5214.80 (0.56%) |
5200.00 |
5143.00 - 5309.25 |
0.8536 times |
Thu 23 October 2025 |
5185.80 (-0.25%) |
5204.95 |
5166.60 - 5299.90 |
0.3566 times |
Fri 17 October 2025 |
5198.70 (0.26%) |
5185.05 |
5081.00 - 5359.95 |
1.616 times |
Fri 10 October 2025 |
5185.35 (0.06%) |
5167.55 |
5076.00 - 5344.55 |
1.2465 times |
Fri 03 October 2025 |
5182.35 (0.11%) |
5157.00 |
5142.15 - 5303.90 |
0.8329 times |
Fri 26 September 2025 |
5176.85 (-4.8%) |
5430.00 |
5119.50 - 5452.00 |
0.7732 times |

Monthly price and charts Abb Strong monthly Stock price targets for Abb 500002 are 5054.28 and 5205.58 | Monthly Target 1 | 5015.25 | | Monthly Target 2 | 5093.3 | | Monthly Target 3 | 5166.55 | | Monthly Target 4 | 5244.6 | | Monthly Target 5 | 5317.85 |
Monthly price and volumes Abb
| Date |
Closing |
Open |
Range |
Volume |
Fri 05 December 2025 |
5171.35 (-0.02%) |
5239.80 |
5088.50 - 5239.80 |
0.0691 times |
Fri 28 November 2025 |
5172.60 (-0.81%) |
5192.05 |
4896.00 - 5278.00 |
0.9128 times |
Fri 31 October 2025 |
5214.80 (0.58%) |
5196.95 |
5076.00 - 5359.95 |
0.824 times |
Tue 30 September 2025 |
5184.95 (3.78%) |
5067.15 |
5017.60 - 5468.95 |
1.2906 times |
Fri 29 August 2025 |
4996.20 (-9.35%) |
5512.15 |
4940.50 - 5523.30 |
1.7805 times |
Thu 31 July 2025 |
5511.40 (-9.31%) |
6107.35 |
5451.20 - 6143.50 |
1.2846 times |
Mon 30 June 2025 |
6076.95 (1.81%) |
5993.80 |
5701.05 - 6299.80 |
0.7279 times |
Fri 30 May 2025 |
5969.20 (8.35%) |
5508.95 |
5070.30 - 6111.00 |
1.0225 times |
Wed 30 April 2025 |
5509.00 (-0.61%) |
5545.00 |
4971.20 - 5734.40 |
1.1266 times |
Fri 28 March 2025 |
5542.55 (12.39%) |
4949.10 |
4893.10 - 5626.00 |
0.9614 times |
Fri 28 February 2025 |
4931.65 (-16.07%) |
5460.05 |
4916.35 - 5870.00 |
1.7998 times |

DMA SMA EMA moving averages of Abb 500002
DMA (daily moving average) of Abb 500002
| DMA period | DMA value | | 5 day DMA | 5167.32 | | 12 day DMA | 5149.38 | | 20 day DMA | 5084.34 | | 35 day DMA | 5141.57 | | 50 day DMA | 5160.78 | | 100 day DMA | 5237.87 | | 150 day DMA | 5445.45 | | 200 day DMA | 5423.67 | EMA (exponential moving average) of Abb 500002
| EMA period | EMA current | EMA prev | EMA prev2 | | 5 day EMA | 5164.83 | 5161.57 | 5157.08 | | 12 day EMA | 5146.74 | 5142.27 | 5137.13 | | 20 day EMA | 5139.84 | 5136.52 | 5132.94 | | 35 day EMA | 5150.08 | 5148.83 | 5147.55 | | 50 day EMA | 5180.14 | 5180.5 | 5180.91 |
SMA (simple moving average) of Abb 500002
| SMA period | SMA current | SMA prev | SMA prev2 | | 5 day SMA | 5167.32 | 5167.57 | 5181.78 | | 12 day SMA | 5149.38 | 5141.75 | 5131.07 | | 20 day SMA | 5084.34 | 5086.93 | 5090.41 | | 35 day SMA | 5141.57 | 5140.94 | 5141.36 | | 50 day SMA | 5160.78 | 5166.11 | 5171.46 | | 100 day SMA | 5237.87 | 5245.15 | 5251.84 | | 150 day SMA | 5445.45 | 5447.87 | 5450.05 | | 200 day SMA | 5423.67 | 5423.81 | 5427.33 |
|
|
