CbdmdInc YCBD full analysis,charts,indicators,moving averages,SMA,DMA,EMA,ADX,MACD,RSICbdmd Inc YCBD WideScreen charts, DMA,SMA,EMA technical analysis, forecast prediction, by indicators ADX,MACD,RSI,CCI AMEX stock exchange
Daily price and charts and targets CbdmdInc Strong Daily Stock price targets for CbdmdInc YCBD are 1.01 and 1.1 | Daily Target 1 | 0.95 | | Daily Target 2 | 1 | | Daily Target 3 | 1.04 | | Daily Target 4 | 1.09 | | Daily Target 5 | 1.13 |
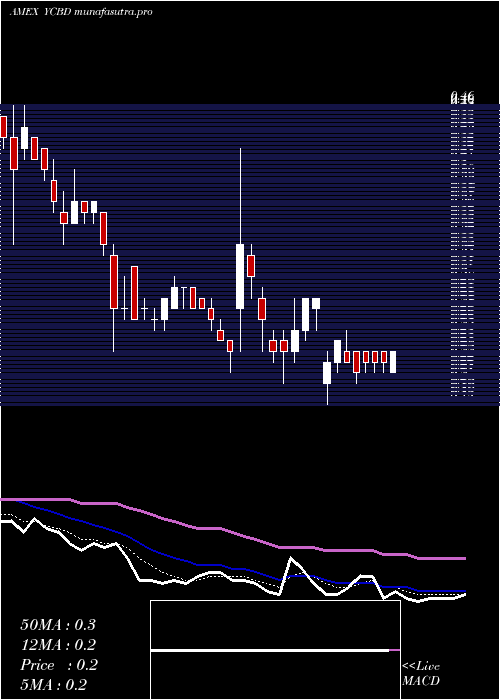
Daily price and volume Cbdmd Inc
| Date |
Closing |
Open |
Range |
Volume |
Thu 23 October 2025 |
1.05 (5%) |
1.05 |
0.99 - 1.08 |
0.6704 times |
Wed 22 October 2025 |
1.00 (-5.66%) |
1.03 |
0.94 - 1.12 |
1.0488 times |
Tue 21 October 2025 |
1.06 (-7.02%) |
1.11 |
1.05 - 1.17 |
0.4606 times |
Mon 20 October 2025 |
1.14 (-0.87%) |
1.15 |
1.11 - 1.20 |
0.3145 times |
Fri 17 October 2025 |
1.15 (9.52%) |
1.05 |
1.00 - 1.23 |
0.7391 times |
Thu 16 October 2025 |
1.05 (-11.76%) |
1.16 |
0.99 - 1.36 |
1.413 times |
Wed 15 October 2025 |
1.19 (0%) |
1.22 |
1.16 - 1.40 |
2.3218 times |
Tue 14 October 2025 |
1.19 (-7.03%) |
1.25 |
1.18 - 1.30 |
0.8136 times |
Mon 13 October 2025 |
1.28 (4.07%) |
1.25 |
1.23 - 1.38 |
0.5085 times |
Fri 10 October 2025 |
1.23 (-15.17%) |
1.43 |
1.23 - 1.44 |
1.7097 times |
Thu 09 October 2025 |
1.45 (1.4%) |
1.49 |
1.43 - 1.61 |
2.9902 times |
Weekly price and charts CbdmdInc Strong weekly Stock price targets for CbdmdInc YCBD are 0.87 and 1.13 | Weekly Target 1 | 0.8 | | Weekly Target 2 | 0.93 | | Weekly Target 3 | 1.0633333333333 | | Weekly Target 4 | 1.19 | | Weekly Target 5 | 1.32 |
Weekly price and volumes for Cbdmd Inc
| Date |
Closing |
Open |
Range |
Volume |
Thu 23 October 2025 |
1.05 (-8.7%) |
1.15 |
0.94 - 1.20 |
0.0453 times |
Fri 17 October 2025 |
1.15 (-6.5%) |
1.25 |
0.99 - 1.40 |
0.1052 times |
Fri 10 October 2025 |
1.23 (6.03%) |
1.22 |
1.11 - 1.61 |
0.2678 times |
Fri 03 October 2025 |
1.16 (87.1%) |
0.73 |
0.72 - 1.94 |
9.4935 times |
Fri 26 September 2025 |
0.62 (-6.06%) |
0.66 |
0.60 - 0.70 |
0.0155 times |
Fri 19 September 2025 |
0.66 (-2.94%) |
0.70 |
0.66 - 0.75 |
0.0121 times |
Fri 12 September 2025 |
0.68 (-6.85%) |
0.73 |
0.68 - 0.73 |
0.0121 times |
Fri 05 September 2025 |
0.73 (-1.35%) |
0.77 |
0.69 - 0.79 |
0.0164 times |
Fri 29 August 2025 |
0.74 (0%) |
0.74 |
0.74 - 0.80 |
0.0063 times |
Fri 29 August 2025 |
0.74 (10.45%) |
0.67 |
0.67 - 0.80 |
0.0259 times |
Fri 22 August 2025 |
0.67 (-11.84%) |
0.76 |
0.59 - 0.76 |
0.0353 times |

Monthly price and charts CbdmdInc Strong monthly Stock price targets for CbdmdInc YCBD are 0.66 and 1.33 | Monthly Target 1 | 0.53 | | Monthly Target 2 | 0.79 | | Monthly Target 3 | 1.2 | | Monthly Target 4 | 1.46 | | Monthly Target 5 | 1.87 |
Monthly price and volumes Cbdmd Inc
| Date |
Closing |
Open |
Range |
Volume |
Thu 23 October 2025 |
1.05 (-13.22%) |
1.22 |
0.94 - 1.61 |
0.5369 times |
Tue 30 September 2025 |
1.21 (63.51%) |
0.77 |
0.60 - 1.94 |
5.352 times |
Fri 29 August 2025 |
0.74 (-17.78%) |
0.89 |
0.59 - 1.01 |
0.0738 times |
Thu 31 July 2025 |
0.90 (1.12%) |
0.92 |
0.82 - 1.01 |
0.0343 times |
Mon 30 June 2025 |
0.89 (-10.1%) |
0.99 |
0.81 - 1.02 |
0.0489 times |
Fri 30 May 2025 |
0.99 (350%) |
0.23 |
0.12 - 1.11 |
0.2365 times |
Wed 30 April 2025 |
0.22 (-4.35%) |
0.27 |
0.18 - 0.42 |
0.6543 times |
Mon 31 March 2025 |
0.23 (-42.5%) |
0.39 |
0.21 - 0.41 |
0.1597 times |
Fri 28 February 2025 |
0.40 (-29.82%) |
0.59 |
0.33 - 0.69 |
0.4936 times |
Fri 31 January 2025 |
0.57 (50%) |
0.38 |
0.36 - 0.82 |
2.4102 times |
Tue 31 December 2024 |
0.38 (-25.49%) |
0.49 |
0.31 - 0.58 |
0.4192 times |

DMA SMA EMA moving averages of Cbdmd Inc YCBD
DMA (daily moving average) of Cbdmd Inc YCBD
| DMA period | DMA value | | 5 day DMA | 1.08 | | 12 day DMA | 1.19 | | 20 day DMA | 1.18 | | 35 day DMA | 0.97 | | 50 day DMA | 0.89 | | 100 day DMA | 0.9 | | 150 day DMA | 0.76 | | 200 day DMA | 0.68 | EMA (exponential moving average) of Cbdmd Inc YCBD
| EMA period | EMA current | EMA prev | EMA prev2 | | 5 day EMA | 1.08 | 1.09 | 1.13 | | 12 day EMA | 1.12 | 1.13 | 1.15 | | 20 day EMA | 1.1 | 1.1 | 1.11 | | 35 day EMA | 1.04 | 1.04 | 1.04 | | 50 day EMA | 0.92 | 0.91 | 0.91 |
SMA (simple moving average) of Cbdmd Inc YCBD
| SMA period | SMA current | SMA prev | SMA prev2 | | 5 day SMA | 1.08 | 1.08 | 1.12 | | 12 day SMA | 1.19 | 1.22 | 1.25 | | 20 day SMA | 1.18 | 1.16 | 1.15 | | 35 day SMA | 0.97 | 0.96 | 0.95 | | 50 day SMA | 0.89 | 0.89 | 0.89 | | 100 day SMA | 0.9 | 0.9 | 0.9 | | 150 day SMA | 0.76 | 0.75 | 0.75 | | 200 day SMA | 0.68 | 0.68 | 0.68 |
|
|
