SpdrS XTL full analysis,charts,indicators,moving averages,SMA,DMA,EMA,ADX,MACD,RSISpdr S XTL WideScreen charts, DMA,SMA,EMA technical analysis, forecast prediction, by indicators ADX,MACD,RSI,CCI AMEX stock exchange
Daily price and charts and targets SpdrS Strong Daily Stock price targets for SpdrS XTL are 149.56 and 150.67 | Daily Target 1 | 149.04 | | Daily Target 2 | 149.58 | | Daily Target 3 | 150.15333333333 | | Daily Target 4 | 150.69 | | Daily Target 5 | 151.26 |
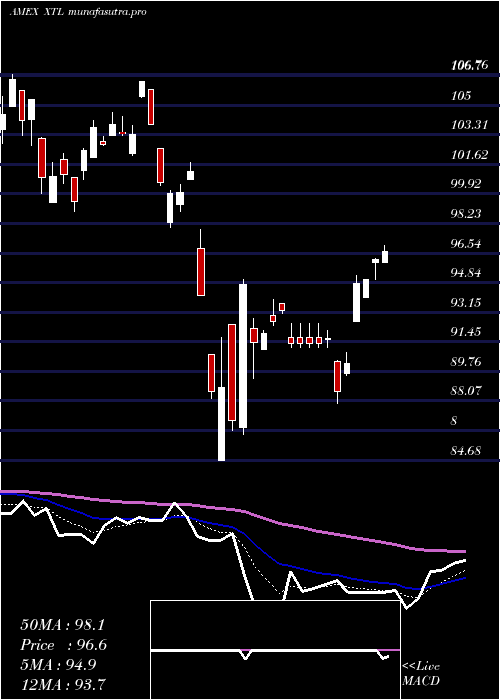
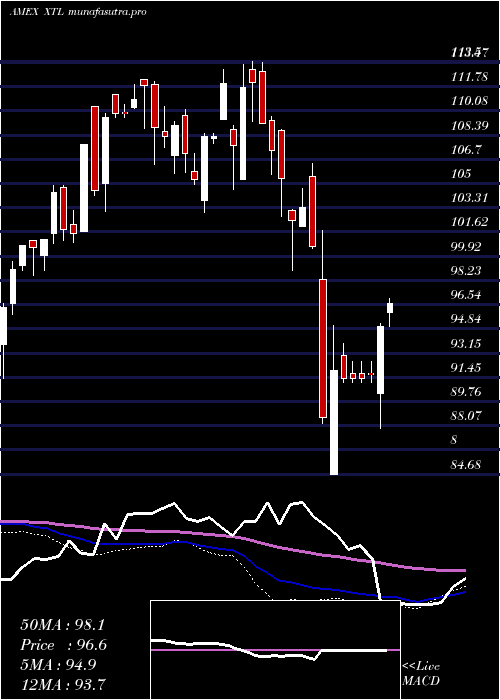
Daily price and volume Spdr S
| Date |
Closing |
Open |
Range |
Volume |
Fri 24 October 2025 |
150.11 (1.87%) |
150.11 |
149.62 - 150.73 |
0.3571 times |
Thu 23 October 2025 |
147.35 (1.75%) |
144.68 |
144.68 - 147.63 |
0.3157 times |
Wed 22 October 2025 |
144.81 (-2.35%) |
146.50 |
142.49 - 146.50 |
6.914 times |
Tue 21 October 2025 |
148.29 (-0.82%) |
149.86 |
147.97 - 150.16 |
0.2866 times |
Mon 20 October 2025 |
149.51 (1.14%) |
150.17 |
149.31 - 150.46 |
0.1555 times |
Fri 17 October 2025 |
147.83 (-1.25%) |
149.32 |
146.20 - 149.32 |
0.1539 times |
Thu 16 October 2025 |
149.70 (-1.95%) |
153.71 |
149.24 - 154.12 |
0.2873 times |
Wed 15 October 2025 |
152.67 (0.71%) |
153.95 |
151.28 - 154.42 |
0.2832 times |
Tue 14 October 2025 |
151.60 (1.29%) |
148.51 |
146.48 - 152.72 |
0.3281 times |
Mon 13 October 2025 |
149.67 (2.99%) |
148.91 |
147.39 - 153.25 |
0.9186 times |
Fri 10 October 2025 |
145.32 (-4.58%) |
153.50 |
145.14 - 153.50 |
0.5007 times |
Weekly price and charts SpdrS Strong weekly Stock price targets for SpdrS XTL are 142.18 and 150.42 | Weekly Target 1 | 139.54 | | Weekly Target 2 | 144.82 | | Weekly Target 3 | 147.77666666667 | | Weekly Target 4 | 153.06 | | Weekly Target 5 | 156.02 |
Weekly price and volumes for Spdr S
| Date |
Closing |
Open |
Range |
Volume |
Fri 24 October 2025 |
150.11 (1.54%) |
150.17 |
142.49 - 150.73 |
3.4821 times |
Fri 17 October 2025 |
147.83 (1.73%) |
148.91 |
146.20 - 154.42 |
0.8548 times |
Fri 10 October 2025 |
145.32 (-0.66%) |
147.57 |
145.14 - 153.50 |
0.9086 times |
Fri 03 October 2025 |
146.29 (5.38%) |
140.20 |
138.57 - 146.97 |
1.1959 times |
Fri 26 September 2025 |
138.82 (-1.23%) |
139.55 |
136.15 - 143.36 |
0.5751 times |
Fri 19 September 2025 |
140.55 (2.02%) |
138.92 |
137.95 - 141.93 |
0.5826 times |
Fri 12 September 2025 |
137.77 (1.56%) |
135.33 |
135.08 - 140.42 |
0.7039 times |
Fri 05 September 2025 |
135.66 (1.41%) |
131.18 |
130.63 - 136.47 |
0.4268 times |
Fri 29 August 2025 |
133.77 (0%) |
134.45 |
133.41 - 134.45 |
0.3684 times |
Fri 29 August 2025 |
133.77 (3.2%) |
129.43 |
129.43 - 134.51 |
0.9016 times |
Fri 22 August 2025 |
129.62 (2.47%) |
127.11 |
123.90 - 130.11 |
0.9555 times |
Monthly price and charts SpdrS Strong monthly Stock price targets for SpdrS XTL are 144.85 and 159.69 | Monthly Target 1 | 133.2 | | Monthly Target 2 | 141.65 | | Monthly Target 3 | 148.03666666667 | | Monthly Target 4 | 156.49 | | Monthly Target 5 | 162.88 |
Monthly price and volumes Spdr S
| Date |
Closing |
Open |
Range |
Volume |
Fri 24 October 2025 |
150.11 (7.28%) |
139.58 |
139.58 - 154.42 |
1.7163 times |
Tue 30 September 2025 |
139.92 (4.6%) |
131.18 |
130.63 - 143.36 |
0.6657 times |
Fri 29 August 2025 |
133.77 (11.22%) |
117.55 |
114.88 - 134.51 |
0.935 times |
Thu 31 July 2025 |
120.27 (2.52%) |
117.18 |
116.03 - 122.36 |
1.0542 times |
Mon 30 June 2025 |
117.31 (14.84%) |
101.24 |
101.24 - 118.00 |
0.5329 times |
Fri 30 May 2025 |
102.15 (5.88%) |
97.71 |
96.86 - 106.03 |
0.6829 times |
Wed 30 April 2025 |
96.48 (-3.47%) |
99.35 |
84.68 - 101.72 |
1.5889 times |
Mon 31 March 2025 |
99.95 (-6.88%) |
108.69 |
97.99 - 108.80 |
1.2695 times |
Fri 28 February 2025 |
107.33 (-0.33%) |
105.31 |
105.31 - 113.50 |
0.5133 times |
Fri 31 January 2025 |
107.68 (0.6%) |
108.13 |
103.00 - 112.99 |
1.0414 times |
Tue 31 December 2024 |
107.04 (-2.62%) |
110.30 |
105.70 - 112.26 |
1.0673 times |

DMA SMA EMA moving averages of Spdr S XTL
DMA (daily moving average) of Spdr S XTL
| DMA period | DMA value | | 5 day DMA | 148.01 | | 12 day DMA | 149.1 | | 20 day DMA | 147.56 | | 35 day DMA | 143.98 | | 50 day DMA | 140.18 | | 100 day DMA | 128.68 | | 150 day DMA | 118.52 | | 200 day DMA | 115.71 | EMA (exponential moving average) of Spdr S XTL
| EMA period | EMA current | EMA prev | EMA prev2 | | 5 day EMA | 148.41 | 147.56 | 147.67 | | 12 day EMA | 148.14 | 147.78 | 147.86 | | 20 day EMA | 146.84 | 146.5 | 146.41 | | 35 day EMA | 143.62 | 143.24 | 143 | | 50 day EMA | 139.89 | 139.47 | 139.15 |
SMA (simple moving average) of Spdr S XTL
| SMA period | SMA current | SMA prev | SMA prev2 | | 5 day SMA | 148.01 | 147.56 | 148.03 | | 12 day SMA | 149.1 | 149.26 | 149.31 | | 20 day SMA | 147.56 | 146.99 | 146.56 | | 35 day SMA | 143.98 | 143.57 | 143.23 | | 50 day SMA | 140.18 | 139.7 | 139.28 | | 100 day SMA | 128.68 | 128.21 | 127.76 | | 150 day SMA | 118.52 | 118.21 | 117.92 | | 200 day SMA | 115.71 | 115.5 | 115.3 |
|
|
