SpdrS XSW full analysis,charts,indicators,moving averages,SMA,DMA,EMA,ADX,MACD,RSISpdr S XSW WideScreen charts, DMA,SMA,EMA technical analysis, forecast prediction, by indicators ADX,MACD,RSI,CCI AMEX stock exchange
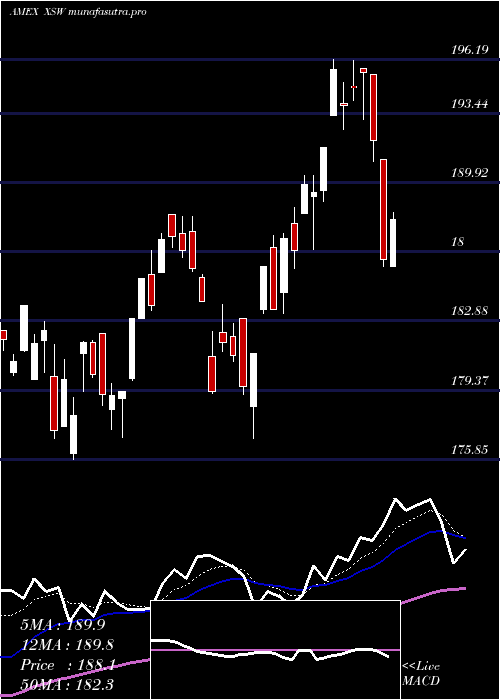
Daily price and charts and targets SpdrS Strong Daily Stock price targets for SpdrS XSW are 197.9 and 200.31 | Daily Target 1 | 195.93 | | Daily Target 2 | 197.46 | | Daily Target 3 | 198.34333333333 | | Daily Target 4 | 199.87 | | Daily Target 5 | 200.75 |
Daily price and volume Spdr S
| Date |
Closing |
Open |
Range |
Volume |
Thu 23 October 2025 |
198.98 (1.23%) |
197.02 |
196.82 - 199.23 |
0.4152 times |
Wed 22 October 2025 |
196.57 (-2.15%) |
199.82 |
195.85 - 199.82 |
0.369 times |
Tue 21 October 2025 |
200.89 (0.89%) |
198.54 |
198.04 - 202.20 |
0.4214 times |
Mon 20 October 2025 |
199.11 (1.93%) |
198.00 |
198.00 - 199.91 |
0.5347 times |
Fri 17 October 2025 |
195.34 (-0.45%) |
194.57 |
193.12 - 195.50 |
1.8208 times |
Thu 16 October 2025 |
196.23 (-2.29%) |
202.29 |
195.85 - 202.29 |
0.1054 times |
Wed 15 October 2025 |
200.82 (0.09%) |
203.74 |
198.63 - 203.74 |
0.4477 times |
Tue 14 October 2025 |
200.63 (0.63%) |
196.25 |
195.03 - 200.93 |
2.3372 times |
Mon 13 October 2025 |
199.38 (2.5%) |
198.12 |
195.96 - 199.65 |
2.6203 times |
Fri 10 October 2025 |
194.52 (-3.64%) |
203.65 |
194.31 - 204.00 |
0.9283 times |
Thu 09 October 2025 |
201.87 (0.31%) |
201.37 |
199.59 - 201.87 |
0.823 times |
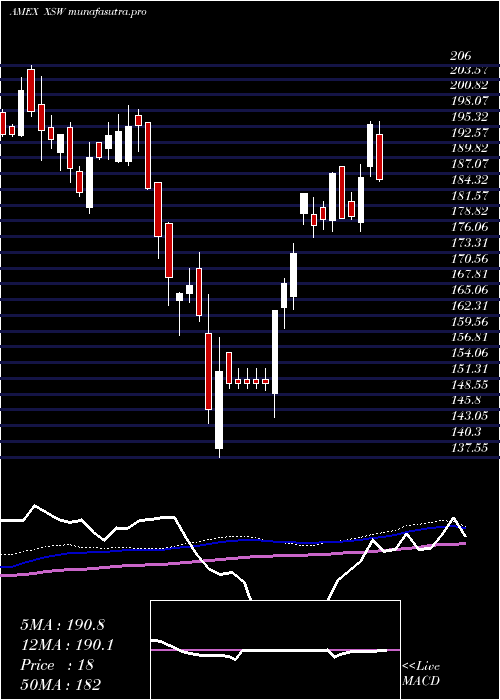
Weekly price and charts SpdrS Strong weekly Stock price targets for SpdrS XSW are 197.42 and 203.77 | Weekly Target 1 | 192.66 | | Weekly Target 2 | 195.82 | | Weekly Target 3 | 199.01 | | Weekly Target 4 | 202.17 | | Weekly Target 5 | 205.36 |
Weekly price and volumes for Spdr S
| Date |
Closing |
Open |
Range |
Volume |
Thu 23 October 2025 |
198.98 (1.86%) |
198.00 |
195.85 - 202.20 |
0.2993 times |
Fri 17 October 2025 |
195.34 (0.42%) |
198.12 |
193.12 - 203.74 |
1.261 times |
Fri 10 October 2025 |
194.52 (-2.47%) |
201.75 |
194.31 - 204.00 |
0.6475 times |
Fri 03 October 2025 |
199.44 (-0.04%) |
201.33 |
195.93 - 202.07 |
0.4864 times |
Fri 26 September 2025 |
199.51 (-1.22%) |
201.69 |
197.08 - 205.76 |
0.7281 times |
Fri 19 September 2025 |
201.98 (4.11%) |
195.05 |
194.48 - 203.27 |
2.2318 times |
Fri 12 September 2025 |
194.01 (1.62%) |
191.66 |
191.44 - 196.07 |
2.43 times |
Fri 05 September 2025 |
190.92 (0.07%) |
187.19 |
184.85 - 191.92 |
1.2286 times |
Fri 29 August 2025 |
190.78 (0%) |
191.22 |
190.08 - 191.41 |
0.0974 times |
Fri 29 August 2025 |
190.78 (1.37%) |
187.44 |
185.55 - 191.41 |
0.59 times |
Fri 22 August 2025 |
188.21 (2.29%) |
184.08 |
179.61 - 188.90 |
0.9149 times |
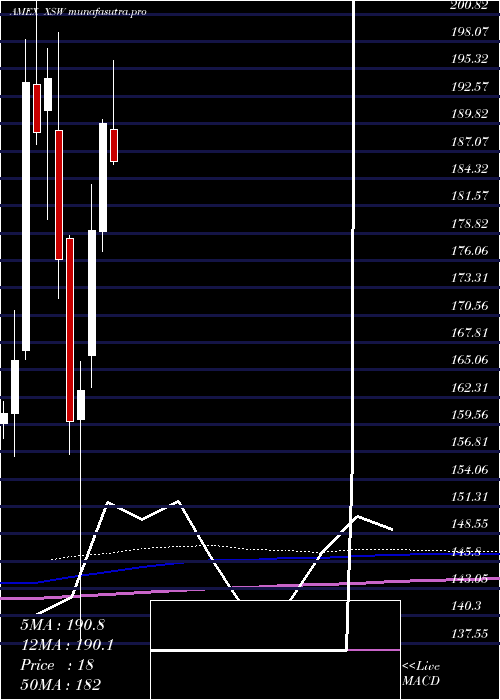
Monthly price and charts SpdrS Strong monthly Stock price targets for SpdrS XSW are 196.05 and 206.93 | Monthly Target 1 | 187.82 | | Monthly Target 2 | 193.4 | | Monthly Target 3 | 198.7 | | Monthly Target 4 | 204.28 | | Monthly Target 5 | 209.58 |
Monthly price and volumes Spdr S
| Date |
Closing |
Open |
Range |
Volume |
Thu 23 October 2025 |
198.98 (0.62%) |
197.45 |
193.12 - 204.00 |
0.3636 times |
Tue 30 September 2025 |
197.76 (3.66%) |
187.19 |
184.85 - 205.76 |
0.9742 times |
Fri 29 August 2025 |
190.78 (2.07%) |
184.04 |
176.56 - 191.41 |
0.4462 times |
Thu 31 July 2025 |
186.91 (-1.53%) |
189.21 |
185.67 - 196.19 |
0.5642 times |
Mon 30 June 2025 |
189.82 (5.99%) |
178.95 |
176.92 - 190.26 |
0.6881 times |
Fri 30 May 2025 |
179.10 (9.87%) |
166.46 |
163.31 - 183.69 |
1.0855 times |
Wed 30 April 2025 |
163.01 (1.97%) |
160.04 |
137.55 - 165.90 |
1.2589 times |
Mon 31 March 2025 |
159.86 (-9.25%) |
178.30 |
156.52 - 178.57 |
1.6316 times |
Fri 28 February 2025 |
176.15 (-9.37%) |
189.13 |
172.25 - 199.00 |
1.4517 times |
Fri 31 January 2025 |
194.36 (2.86%) |
191.11 |
180.20 - 197.39 |
1.5359 times |
Tue 31 December 2024 |
188.96 (-2.6%) |
193.72 |
187.72 - 206.00 |
1.1873 times |
DMA SMA EMA moving averages of Spdr S XSW
DMA (daily moving average) of Spdr S XSW
| DMA period | DMA value | | 5 day DMA | 198.18 | | 12 day DMA | 198.8 | | 20 day DMA | 198.98 | | 35 day DMA | 198.39 | | 50 day DMA | 194.93 | | 100 day DMA | 190.93 | | 150 day DMA | 182.2 | | 200 day DMA | 182.63 | EMA (exponential moving average) of Spdr S XSW
| EMA period | EMA current | EMA prev | EMA prev2 | | 5 day EMA | 198.46 | 198.2 | 199.02 | | 12 day EMA | 198.63 | 198.57 | 198.93 | | 20 day EMA | 198.38 | 198.32 | 198.5 | | 35 day EMA | 196.22 | 196.06 | 196.03 | | 50 day EMA | 194.11 | 193.91 | 193.8 |
SMA (simple moving average) of Spdr S XSW
| SMA period | SMA current | SMA prev | SMA prev2 | | 5 day SMA | 198.18 | 197.63 | 198.48 | | 12 day SMA | 198.8 | 198.75 | 199.2 | | 20 day SMA | 198.98 | 198.93 | 199.18 | | 35 day SMA | 198.39 | 198.06 | 197.82 | | 50 day SMA | 194.93 | 194.61 | 194.37 | | 100 day SMA | 190.93 | 190.74 | 190.56 | | 150 day SMA | 182.2 | 181.99 | 181.81 | | 200 day SMA | 182.63 | 182.58 | 182.55 |
|
|
