SpdrS XME full analysis,charts,indicators,moving averages,SMA,DMA,EMA,ADX,MACD,RSISpdr S XME WideScreen charts, DMA,SMA,EMA technical analysis, forecast prediction, by indicators ADX,MACD,RSI,CCI AMEX stock exchange
Daily price and charts and targets SpdrS Strong Daily Stock price targets for SpdrS XME are 98.36 and 100.43 | Daily Target 1 | 96.85 | | Daily Target 2 | 97.8 | | Daily Target 3 | 98.916666666667 | | Daily Target 4 | 99.87 | | Daily Target 5 | 100.99 |
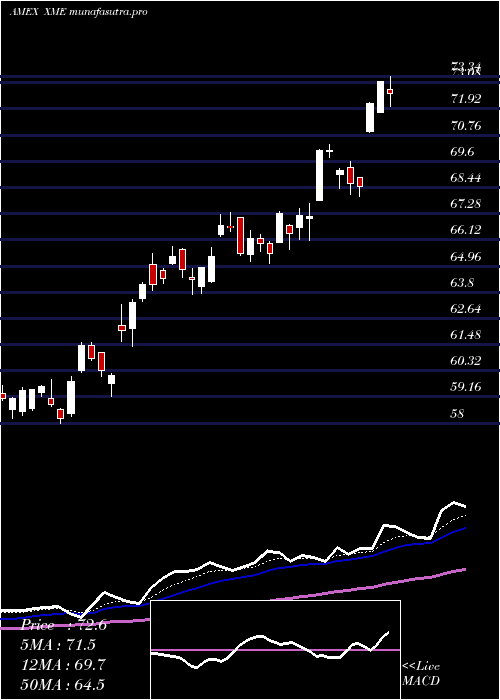
Daily price and volume Spdr S
| Date |
Closing |
Open |
Range |
Volume |
Thu 23 October 2025 |
98.76 (1.45%) |
98.56 |
97.96 - 100.03 |
0.4041 times |
Wed 22 October 2025 |
97.35 (-2.95%) |
97.54 |
95.37 - 99.45 |
1.4398 times |
Tue 21 October 2025 |
100.31 (-6.5%) |
103.28 |
99.72 - 103.28 |
1.2392 times |
Mon 20 October 2025 |
107.28 (4.91%) |
103.50 |
102.54 - 107.59 |
0.5323 times |
Fri 17 October 2025 |
102.26 (-4.08%) |
105.19 |
101.21 - 105.41 |
0.8373 times |
Thu 16 October 2025 |
106.61 (-1.22%) |
108.86 |
106.00 - 109.97 |
0.6646 times |
Wed 15 October 2025 |
107.93 (-0.93%) |
110.25 |
105.48 - 111.09 |
1.1101 times |
Tue 14 October 2025 |
108.94 (0.8%) |
106.91 |
104.07 - 110.60 |
1.2674 times |
Mon 13 October 2025 |
108.08 (7.14%) |
105.89 |
105.89 - 108.93 |
1.2816 times |
Fri 10 October 2025 |
100.88 (-1.45%) |
103.83 |
100.77 - 105.76 |
1.2235 times |
Thu 09 October 2025 |
102.36 (0.09%) |
103.86 |
101.63 - 105.18 |
0.8775 times |
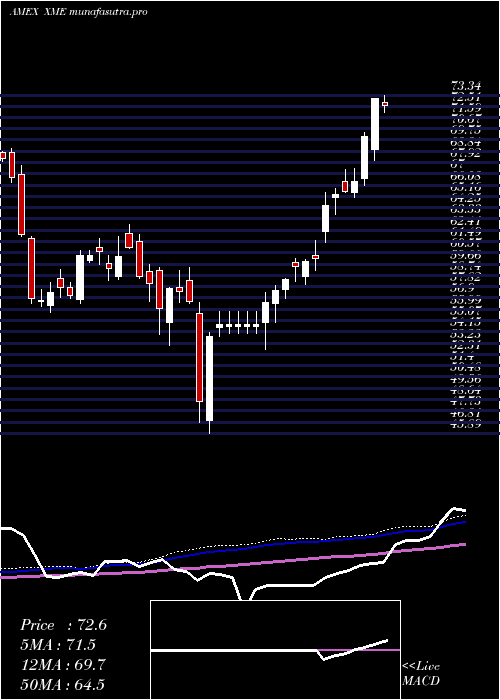
Weekly price and charts SpdrS Strong weekly Stock price targets for SpdrS XME are 90.96 and 103.18 | Weekly Target 1 | 88.35 | | Weekly Target 2 | 93.56 | | Weekly Target 3 | 100.57333333333 | | Weekly Target 4 | 105.78 | | Weekly Target 5 | 112.79 |
Weekly price and volumes for Spdr S
| Date |
Closing |
Open |
Range |
Volume |
Thu 23 October 2025 |
98.76 (-3.42%) |
103.50 |
95.37 - 107.59 |
1.2852 times |
Fri 17 October 2025 |
102.26 (1.37%) |
105.89 |
101.21 - 111.09 |
1.8346 times |
Fri 10 October 2025 |
100.88 (3.4%) |
99.01 |
98.08 - 105.76 |
1.5566 times |
Fri 03 October 2025 |
97.56 (5.81%) |
93.79 |
91.96 - 99.16 |
0.9582 times |
Fri 26 September 2025 |
92.20 (2%) |
90.55 |
89.20 - 92.91 |
0.9198 times |
Fri 19 September 2025 |
90.39 (5.63%) |
86.02 |
85.82 - 91.05 |
1.1715 times |
Fri 12 September 2025 |
85.57 (1.95%) |
84.36 |
83.12 - 86.60 |
0.9108 times |
Fri 05 September 2025 |
83.93 (1.94%) |
81.46 |
80.14 - 83.94 |
0.619 times |
Fri 29 August 2025 |
82.33 (0%) |
81.84 |
81.24 - 82.41 |
0.1382 times |
Fri 29 August 2025 |
82.33 (2.75%) |
80.14 |
80.12 - 82.41 |
0.6061 times |
Fri 22 August 2025 |
80.13 (0.44%) |
79.52 |
76.46 - 80.56 |
0.8374 times |
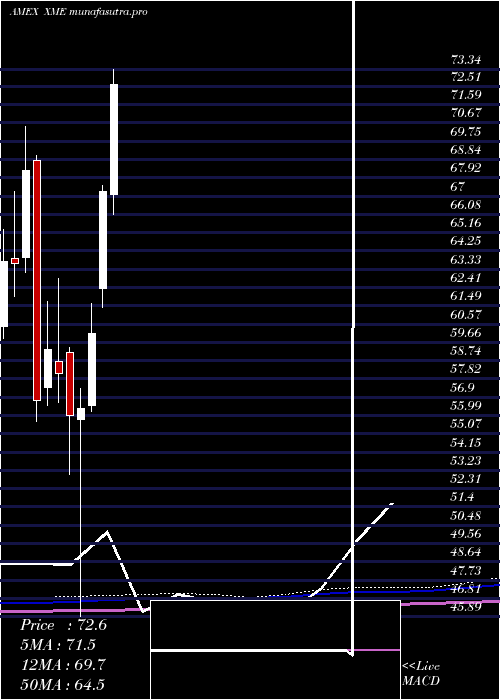
Monthly price and charts SpdrS Strong monthly Stock price targets for SpdrS XME are 95.97 and 113.89 | Monthly Target 1 | 83.09 | | Monthly Target 2 | 90.92 | | Monthly Target 3 | 101.00666666667 | | Monthly Target 4 | 108.84 | | Monthly Target 5 | 118.93 |
Monthly price and volumes Spdr S
| Date |
Closing |
Open |
Range |
Volume |
Thu 23 October 2025 |
98.76 (5.98%) |
93.17 |
93.17 - 111.09 |
1.4615 times |
Tue 30 September 2025 |
93.19 (13.19%) |
81.46 |
80.14 - 93.81 |
1.106 times |
Fri 29 August 2025 |
82.33 (12.29%) |
71.89 |
71.07 - 82.41 |
1.0139 times |
Thu 31 July 2025 |
73.32 (9.07%) |
67.06 |
66.09 - 78.86 |
1.1704 times |
Mon 30 June 2025 |
67.22 (11.85%) |
62.35 |
61.41 - 67.51 |
0.8155 times |
Fri 30 May 2025 |
60.10 (6.65%) |
56.47 |
56.21 - 61.59 |
0.8571 times |
Wed 30 April 2025 |
56.35 (0.64%) |
55.78 |
45.89 - 57.33 |
0.8827 times |
Mon 31 March 2025 |
55.99 (-3.63%) |
59.16 |
53.05 - 59.40 |
0.8906 times |
Fri 28 February 2025 |
58.10 (-2.02%) |
58.68 |
56.62 - 62.87 |
0.8744 times |
Fri 31 January 2025 |
59.30 (4.49%) |
57.40 |
56.49 - 61.71 |
0.9279 times |
Tue 31 December 2024 |
56.75 (-16.89%) |
68.76 |
55.69 - 69.05 |
0.6421 times |
DMA SMA EMA moving averages of Spdr S XME
DMA (daily moving average) of Spdr S XME
| DMA period | DMA value | | 5 day DMA | 101.19 | | 12 day DMA | 103.59 | | 20 day DMA | 100.43 | | 35 day DMA | 95.02 | | 50 day DMA | 90.61 | | 100 day DMA | 80.85 | | 150 day DMA | 72.73 | | 200 day DMA | 69.3 | EMA (exponential moving average) of Spdr S XME
| EMA period | EMA current | EMA prev | EMA prev2 | | 5 day EMA | 100.72 | 101.7 | 103.88 | | 12 day EMA | 101.42 | 101.9 | 102.73 | | 20 day EMA | 99.7 | 99.8 | 100.06 | | 35 day EMA | 95.62 | 95.44 | 95.33 | | 50 day EMA | 90.78 | 90.45 | 90.17 |
SMA (simple moving average) of Spdr S XME
| SMA period | SMA current | SMA prev | SMA prev2 | | 5 day SMA | 101.19 | 102.76 | 104.88 | | 12 day SMA | 103.59 | 103.6 | 103.68 | | 20 day SMA | 100.43 | 100.08 | 99.74 | | 35 day SMA | 95.02 | 94.53 | 94.08 | | 50 day SMA | 90.61 | 90.25 | 89.93 | | 100 day SMA | 80.85 | 80.47 | 80.1 | | 150 day SMA | 72.73 | 72.46 | 72.2 | | 200 day SMA | 69.3 | 69.1 | 68.9 |
|
|
