RealEstate XLRE full analysis,charts,indicators,moving averages,SMA,DMA,EMA,ADX,MACD,RSIReal Estate XLRE WideScreen charts, DMA,SMA,EMA technical analysis, forecast prediction, by indicators ADX,MACD,RSI,CCI AMEX stock exchange
Daily price and charts and targets RealEstate Strong Daily Stock price targets for RealEstate XLRE are 40.98 and 41.33 | Daily Target 1 | 40.73 | | Daily Target 2 | 40.87 | | Daily Target 3 | 41.08 | | Daily Target 4 | 41.22 | | Daily Target 5 | 41.43 |
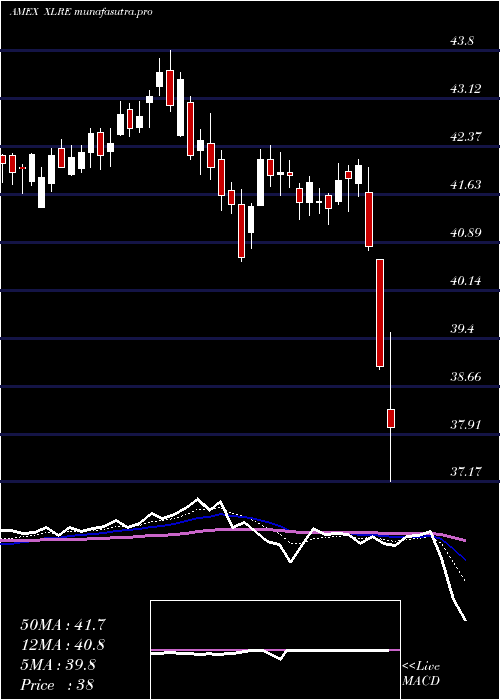
Daily price and volume Real Estate
| Date |
Closing |
Open |
Range |
Volume |
Thu 04 December 2025 |
41.01 (-0.15%) |
41.00 |
40.94 - 41.29 |
1.122 times |
Wed 03 December 2025 |
41.07 (0.17%) |
40.94 |
40.86 - 41.17 |
0.7867 times |
Tue 02 December 2025 |
41.00 (-0.22%) |
41.15 |
40.83 - 41.25 |
0.8968 times |
Mon 01 December 2025 |
41.09 (-1.39%) |
41.23 |
41.08 - 41.39 |
1.0501 times |
Fri 28 November 2025 |
41.67 (0.48%) |
41.48 |
41.42 - 41.79 |
0.6592 times |
Wed 26 November 2025 |
41.47 (0.46%) |
41.21 |
41.14 - 41.69 |
0.8105 times |
Tue 25 November 2025 |
41.28 (0.81%) |
41.06 |
41.04 - 41.46 |
0.9403 times |
Mon 24 November 2025 |
40.95 (0.12%) |
40.86 |
40.63 - 41.04 |
1.0545 times |
Fri 21 November 2025 |
40.90 (1.31%) |
40.65 |
40.44 - 41.08 |
1.3734 times |
Thu 20 November 2025 |
40.37 (-0.35%) |
40.83 |
40.36 - 40.98 |
1.3067 times |
Wed 19 November 2025 |
40.51 (-0.76%) |
40.85 |
40.38 - 40.85 |
1.2586 times |
Weekly price and charts RealEstate Strong weekly Stock price targets for RealEstate XLRE are 40.64 and 41.2 | Weekly Target 1 | 40.52 | | Weekly Target 2 | 40.76 | | Weekly Target 3 | 41.076666666667 | | Weekly Target 4 | 41.32 | | Weekly Target 5 | 41.64 |
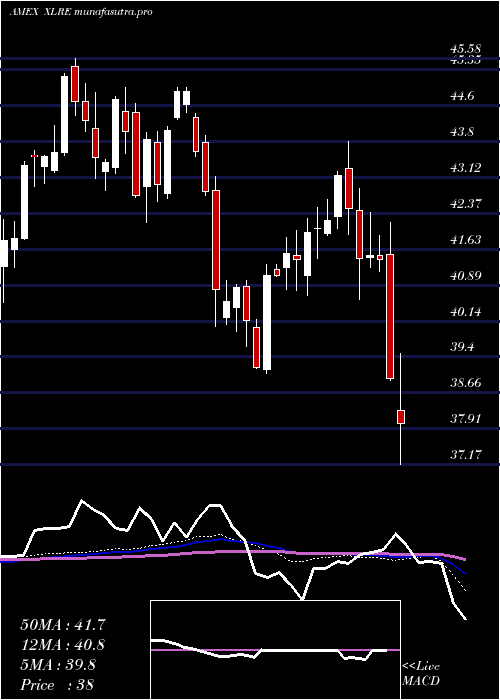
Weekly price and volumes for Real Estate
| Date |
Closing |
Open |
Range |
Volume |
Thu 04 December 2025 |
41.01 (-1.58%) |
41.23 |
40.83 - 41.39 |
0.7484 times |
Fri 28 November 2025 |
41.67 (1.88%) |
40.86 |
40.63 - 41.79 |
0.6725 times |
Fri 21 November 2025 |
40.90 (-0.12%) |
41.10 |
40.36 - 41.11 |
1.1696 times |
Fri 14 November 2025 |
40.95 (-0.8%) |
41.19 |
40.71 - 41.72 |
1.0728 times |
Fri 07 November 2025 |
41.28 (0.93%) |
40.93 |
40.70 - 41.29 |
1.0115 times |
Fri 31 October 2025 |
40.90 (0%) |
40.58 |
40.49 - 41.06 |
0.332 times |
Fri 31 October 2025 |
40.90 (-4.1%) |
42.67 |
40.49 - 42.78 |
2.0885 times |
Fri 24 October 2025 |
42.65 (1.45%) |
42.10 |
42.10 - 42.89 |
1.1868 times |
Fri 17 October 2025 |
42.04 (1.23%) |
40.69 |
40.61 - 42.15 |
1.3835 times |
Tue 07 October 2025 |
41.53 (-1.31%) |
42.10 |
41.35 - 42.19 |
0.3346 times |
Fri 03 October 2025 |
42.08 (0.48%) |
41.92 |
41.69 - 42.40 |
0.8612 times |
Monthly price and charts RealEstate Strong monthly Stock price targets for RealEstate XLRE are 40.64 and 41.2 | Monthly Target 1 | 40.52 | | Monthly Target 2 | 40.76 | | Monthly Target 3 | 41.076666666667 | | Monthly Target 4 | 41.32 | | Monthly Target 5 | 41.64 |
Monthly price and volumes Real Estate
| Date |
Closing |
Open |
Range |
Volume |
Thu 04 December 2025 |
41.01 (-1.58%) |
41.23 |
40.83 - 41.39 |
0.1837 times |
Fri 28 November 2025 |
41.67 (1.88%) |
40.93 |
40.36 - 41.79 |
0.9635 times |
Fri 31 October 2025 |
40.90 (-2.92%) |
42.11 |
40.49 - 42.89 |
1.453 times |
Tue 30 September 2025 |
42.13 (-0.43%) |
41.93 |
41.33 - 42.65 |
0.8404 times |
Fri 29 August 2025 |
42.31 (2.17%) |
41.85 |
40.69 - 42.58 |
1.0823 times |
Thu 31 July 2025 |
41.41 (-0.02%) |
41.35 |
41.16 - 42.96 |
1.2434 times |
Mon 30 June 2025 |
41.42 (-0.74%) |
41.43 |
40.47 - 42.42 |
0.9529 times |
Fri 30 May 2025 |
41.73 (1.04%) |
41.42 |
40.31 - 42.14 |
0.7213 times |
Wed 30 April 2025 |
41.30 (-1.31%) |
41.99 |
35.76 - 42.18 |
1.5838 times |
Mon 31 March 2025 |
41.85 (-3.01%) |
43.30 |
40.60 - 43.86 |
0.9758 times |
Fri 28 February 2025 |
43.15 (4.18%) |
41.08 |
40.68 - 43.25 |
0.7946 times |

DMA SMA EMA moving averages of Real Estate XLRE
DMA (daily moving average) of Real Estate XLRE
| DMA period | DMA value | | 5 day DMA | 41.17 | | 12 day DMA | 41.01 | | 20 day DMA | 41.05 | | 35 day DMA | 41.34 | | 50 day DMA | 41.46 | | 100 day DMA | 41.67 | | 150 day DMA | 41.64 | | 200 day DMA | 41.52 | EMA (exponential moving average) of Real Estate XLRE
| EMA period | EMA current | EMA prev | EMA prev2 | | 5 day EMA | 41.09 | 41.13 | 41.16 | | 12 day EMA | 41.09 | 41.1 | 41.11 | | 20 day EMA | 41.13 | 41.14 | 41.15 | | 35 day EMA | 41.28 | 41.3 | 41.31 | | 50 day EMA | 41.47 | 41.49 | 41.51 |
SMA (simple moving average) of Real Estate XLRE
| SMA period | SMA current | SMA prev | SMA prev2 | | 5 day SMA | 41.17 | 41.26 | 41.3 | | 12 day SMA | 41.01 | 40.98 | 40.97 | | 20 day SMA | 41.05 | 41.04 | 41.04 | | 35 day SMA | 41.34 | 41.37 | 41.37 | | 50 day SMA | 41.46 | 41.48 | 41.5 | | 100 day SMA | 41.67 | 41.68 | 41.68 | | 150 day SMA | 41.64 | 41.63 | 41.63 | | 200 day SMA | 41.52 | 41.53 | 41.53 |
|
|
