FinancialSelect XLF full analysis,charts,indicators,moving averages,SMA,DMA,EMA,ADX,MACD,RSIFinancial Select XLF WideScreen charts, DMA,SMA,EMA technical analysis, forecast prediction, by indicators ADX,MACD,RSI,CCI AMEX stock exchange
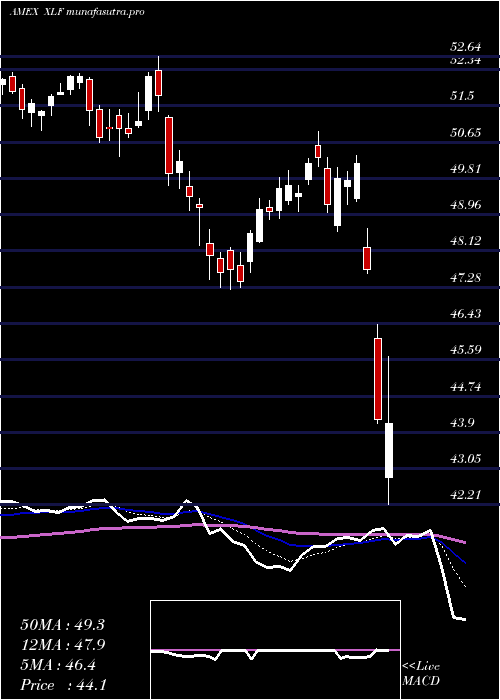
Daily price and charts and targets FinancialSelect Strong Daily Stock price targets for FinancialSelect XLF are 52.22 and 52.61 | Daily Target 1 | 52.11 | | Daily Target 2 | 52.33 | | Daily Target 3 | 52.503333333333 | | Daily Target 4 | 52.72 | | Daily Target 5 | 52.89 |
Daily price and volume Financial Select
| Date |
Closing |
Open |
Range |
Volume |
Thu 23 October 2025 |
52.54 (0.23%) |
52.56 |
52.29 - 52.68 |
0.5239 times |
Wed 22 October 2025 |
52.42 (-0.59%) |
52.78 |
52.12 - 52.82 |
1.0337 times |
Tue 21 October 2025 |
52.73 (-0.09%) |
52.66 |
52.66 - 53.13 |
0.6439 times |
Mon 20 October 2025 |
52.78 (1.15%) |
52.40 |
52.29 - 52.90 |
0.6565 times |
Fri 17 October 2025 |
52.18 (0.81%) |
51.36 |
50.92 - 52.36 |
1.0155 times |
Thu 16 October 2025 |
51.76 (-2.78%) |
53.29 |
51.54 - 53.38 |
1.684 times |
Wed 15 October 2025 |
53.24 (0%) |
53.43 |
52.86 - 53.76 |
0.8154 times |
Tue 14 October 2025 |
53.24 (1.1%) |
52.45 |
52.25 - 53.65 |
1.2911 times |
Mon 13 October 2025 |
52.66 (0.96%) |
52.55 |
52.34 - 52.82 |
0.8178 times |
Fri 10 October 2025 |
52.16 (-2.18%) |
53.46 |
52.16 - 53.68 |
1.5182 times |
Thu 09 October 2025 |
53.32 (-0.36%) |
53.63 |
53.19 - 53.81 |
0.6998 times |
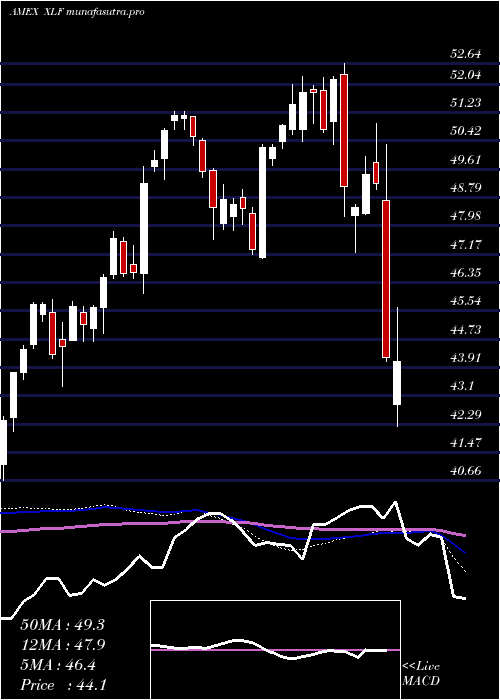
Weekly price and charts FinancialSelect Strong weekly Stock price targets for FinancialSelect XLF are 52.33 and 53.34 | Weekly Target 1 | 51.59 | | Weekly Target 2 | 52.06 | | Weekly Target 3 | 52.596666666667 | | Weekly Target 4 | 53.07 | | Weekly Target 5 | 53.61 |
Weekly price and volumes for Financial Select
| Date |
Closing |
Open |
Range |
Volume |
Thu 23 October 2025 |
52.54 (0.69%) |
52.40 |
52.12 - 53.13 |
0.8525 times |
Fri 17 October 2025 |
52.18 (0.04%) |
52.55 |
50.92 - 53.76 |
1.6775 times |
Fri 10 October 2025 |
52.16 (-2.9%) |
53.86 |
52.16 - 54.07 |
1.209 times |
Fri 03 October 2025 |
53.72 (-0.26%) |
54.04 |
53.06 - 54.24 |
0.8763 times |
Fri 26 September 2025 |
53.86 (-0.72%) |
53.70 |
53.24 - 54.49 |
0.8639 times |
Fri 19 September 2025 |
54.25 (0.84%) |
53.89 |
53.27 - 54.50 |
1.1796 times |
Fri 12 September 2025 |
53.80 (1.38%) |
53.09 |
52.83 - 54.07 |
1.1298 times |
Fri 05 September 2025 |
53.07 (-1.7%) |
53.70 |
52.87 - 54.25 |
1.0229 times |
Fri 29 August 2025 |
53.99 (0%) |
53.90 |
53.80 - 54.14 |
0.2219 times |
Fri 29 August 2025 |
53.99 (0.78%) |
53.47 |
53.10 - 54.14 |
0.9665 times |
Fri 22 August 2025 |
53.57 (2.12%) |
52.38 |
52.29 - 53.68 |
1.0195 times |
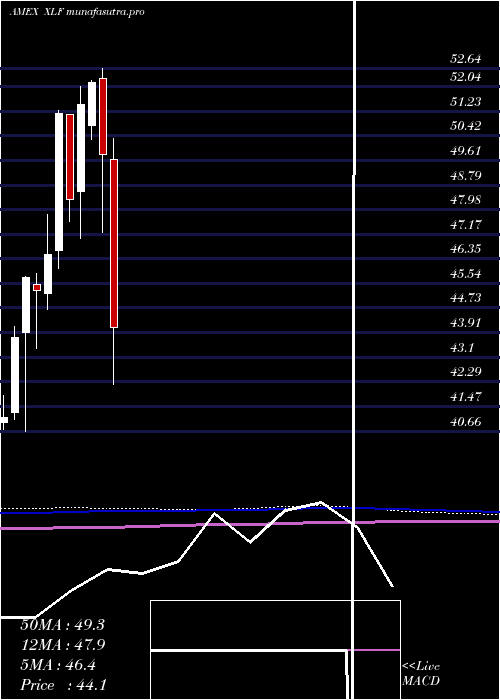
Monthly price and charts FinancialSelect Strong monthly Stock price targets for FinancialSelect XLF are 50.16 and 53.31 | Monthly Target 1 | 49.36 | | Monthly Target 2 | 50.95 | | Monthly Target 3 | 52.51 | | Monthly Target 4 | 54.1 | | Monthly Target 5 | 55.66 |
Monthly price and volumes Financial Select
| Date |
Closing |
Open |
Range |
Volume |
Thu 23 October 2025 |
52.54 (-2.47%) |
53.61 |
50.92 - 54.07 |
0.8099 times |
Tue 30 September 2025 |
53.87 (-0.22%) |
53.70 |
52.83 - 54.50 |
0.8543 times |
Fri 29 August 2025 |
53.99 (3.09%) |
51.72 |
51.05 - 54.14 |
0.8857 times |
Thu 31 July 2025 |
52.37 (0%) |
52.24 |
51.33 - 53.49 |
0.9242 times |
Mon 30 June 2025 |
52.37 (2.77%) |
50.61 |
49.81 - 52.44 |
0.8126 times |
Fri 30 May 2025 |
50.96 (4.51%) |
48.58 |
48.44 - 51.77 |
0.8297 times |
Wed 30 April 2025 |
48.76 (-2.11%) |
49.62 |
42.21 - 50.33 |
1.5498 times |
Mon 31 March 2025 |
49.81 (-4.54%) |
52.32 |
47.22 - 52.64 |
1.2665 times |
Fri 28 February 2025 |
52.18 (1.38%) |
50.75 |
50.31 - 52.26 |
0.9686 times |
Fri 31 January 2025 |
51.47 (6.5%) |
48.58 |
47.04 - 52.04 |
1.0987 times |
Tue 31 December 2024 |
48.33 (-5.53%) |
51.13 |
47.59 - 51.13 |
0.7509 times |
DMA SMA EMA moving averages of Financial Select XLF
DMA (daily moving average) of Financial Select XLF
| DMA period | DMA value | | 5 day DMA | 52.53 | | 12 day DMA | 52.71 | | 20 day DMA | 53.12 | | 35 day DMA | 53.35 | | 50 day DMA | 53.36 | | 100 day DMA | 52.63 | | 150 day DMA | 51.35 | | 200 day DMA | 51.09 | EMA (exponential moving average) of Financial Select XLF
| EMA period | EMA current | EMA prev | EMA prev2 | | 5 day EMA | 52.56 | 52.57 | 52.64 | | 12 day EMA | 52.76 | 52.8 | 52.87 | | 20 day EMA | 52.96 | 53 | 53.06 | | 35 day EMA | 53.08 | 53.11 | 53.15 | | 50 day EMA | 53.19 | 53.22 | 53.25 |
SMA (simple moving average) of Financial Select XLF
| SMA period | SMA current | SMA prev | SMA prev2 | | 5 day SMA | 52.53 | 52.37 | 52.54 | | 12 day SMA | 52.71 | 52.81 | 52.92 | | 20 day SMA | 53.12 | 53.16 | 53.22 | | 35 day SMA | 53.35 | 53.4 | 53.43 | | 50 day SMA | 53.36 | 53.36 | 53.37 | | 100 day SMA | 52.63 | 52.62 | 52.6 | | 150 day SMA | 51.35 | 51.33 | 51.3 | | 200 day SMA | 51.09 | 51.07 | 51.05 |
|
|
