EnergySelect XLE full analysis,charts,indicators,moving averages,SMA,DMA,EMA,ADX,MACD,RSIEnergy Select XLE WideScreen charts, DMA,SMA,EMA technical analysis, forecast prediction, by indicators ADX,MACD,RSI,CCI AMEX stock exchange
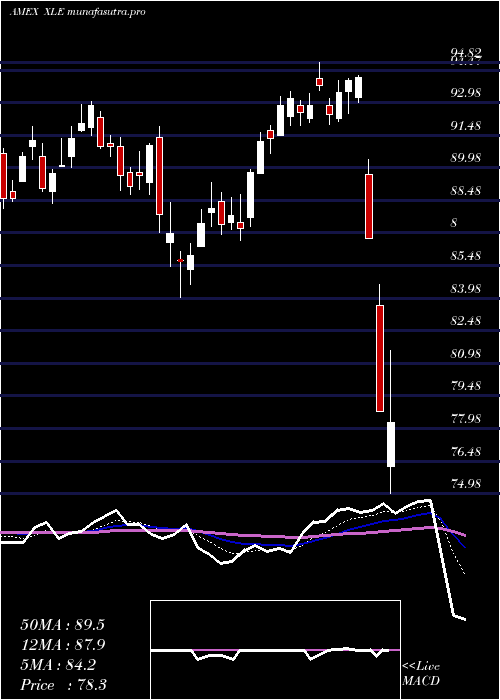
Daily price and charts and targets EnergySelect Strong Daily Stock price targets for EnergySelect XLE are 91.88 and 92.74 | Daily Target 1 | 91.18 | | Daily Target 2 | 91.71 | | Daily Target 3 | 92.04 | | Daily Target 4 | 92.57 | | Daily Target 5 | 92.9 |
Daily price and volume Energy Select
| Date |
Closing |
Open |
Range |
Volume |
Thu 04 December 2025 |
92.24 (0.45%) |
91.92 |
91.51 - 92.37 |
0.7058 times |
Wed 03 December 2025 |
91.83 (1.89%) |
90.75 |
90.62 - 91.99 |
1.1053 times |
Tue 02 December 2025 |
90.13 (-1.3%) |
91.45 |
89.69 - 91.50 |
0.9441 times |
Mon 01 December 2025 |
91.32 (0.96%) |
90.58 |
90.51 - 91.82 |
1.1409 times |
Fri 28 November 2025 |
90.45 (1.33%) |
89.33 |
89.20 - 90.84 |
0.6105 times |
Wed 26 November 2025 |
89.26 (0.74%) |
88.67 |
88.51 - 89.92 |
0.7387 times |
Tue 25 November 2025 |
88.60 (-0.62%) |
89.19 |
87.88 - 89.20 |
0.8329 times |
Mon 24 November 2025 |
89.15 (-0.3%) |
89.53 |
87.79 - 89.59 |
0.9566 times |
Fri 21 November 2025 |
89.42 (0.63%) |
89.01 |
88.07 - 89.81 |
1.4402 times |
Thu 20 November 2025 |
88.86 (-1.13%) |
90.34 |
88.79 - 91.57 |
1.525 times |
Wed 19 November 2025 |
89.88 (-1.27%) |
89.45 |
88.82 - 90.17 |
1.5042 times |
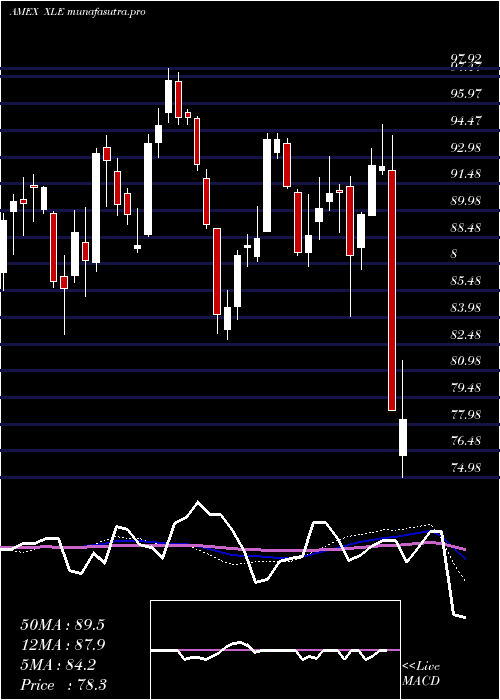
Weekly price and charts EnergySelect Strong weekly Stock price targets for EnergySelect XLE are 90.97 and 93.65 | Weekly Target 1 | 88.75 | | Weekly Target 2 | 90.5 | | Weekly Target 3 | 91.433333333333 | | Weekly Target 4 | 93.18 | | Weekly Target 5 | 94.11 |
Weekly price and volumes for Energy Select
| Date |
Closing |
Open |
Range |
Volume |
Thu 04 December 2025 |
92.24 (1.98%) |
90.58 |
89.69 - 92.37 |
0.9945 times |
Fri 28 November 2025 |
90.45 (1.15%) |
89.53 |
87.79 - 90.84 |
0.8012 times |
Fri 21 November 2025 |
89.42 (-2.83%) |
91.91 |
88.07 - 91.94 |
1.7299 times |
Fri 14 November 2025 |
92.02 (2.78%) |
89.77 |
88.61 - 92.22 |
1.4292 times |
Fri 07 November 2025 |
89.53 (1.59%) |
87.06 |
86.37 - 89.75 |
0.9822 times |
Fri 31 October 2025 |
88.13 (0%) |
87.70 |
87.32 - 88.63 |
0.2523 times |
Fri 31 October 2025 |
88.13 (0.07%) |
88.35 |
87.28 - 88.64 |
1.0896 times |
Fri 24 October 2025 |
88.07 (2.43%) |
85.90 |
85.86 - 89.73 |
1.1394 times |
Fri 17 October 2025 |
85.98 (-3.92%) |
85.86 |
84.70 - 87.41 |
1.1736 times |
Tue 07 October 2025 |
89.49 (0.65%) |
89.44 |
87.91 - 89.91 |
0.408 times |
Fri 03 October 2025 |
88.91 (-3.35%) |
91.35 |
88.35 - 91.48 |
1.496 times |
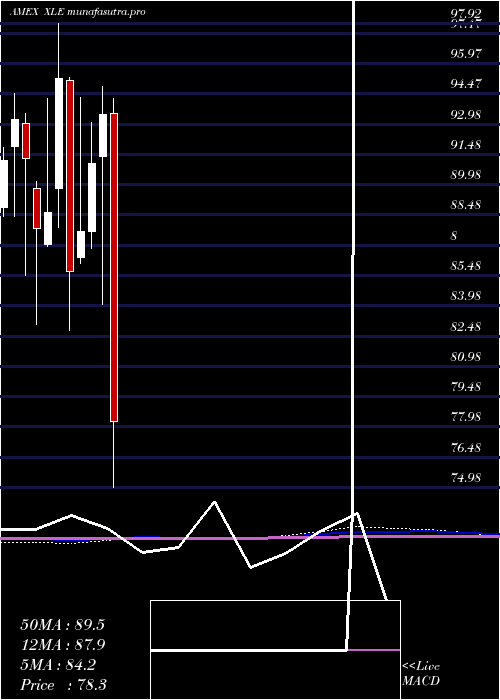
Monthly price and charts EnergySelect Strong monthly Stock price targets for EnergySelect XLE are 90.97 and 93.65 | Monthly Target 1 | 88.75 | | Monthly Target 2 | 90.5 | | Monthly Target 3 | 91.433333333333 | | Monthly Target 4 | 93.18 | | Monthly Target 5 | 94.11 |
Monthly price and volumes Energy Select
| Date |
Closing |
Open |
Range |
Volume |
Thu 04 December 2025 |
92.24 (1.98%) |
90.58 |
89.69 - 92.37 |
0.1696 times |
Fri 28 November 2025 |
90.45 (2.63%) |
87.06 |
86.37 - 92.22 |
0.843 times |
Fri 31 October 2025 |
88.13 (-1.35%) |
88.90 |
84.70 - 89.93 |
0.8123 times |
Tue 30 September 2025 |
89.34 (-1.16%) |
90.15 |
86.39 - 92.91 |
1.1142 times |
Fri 29 August 2025 |
90.39 (3.65%) |
86.88 |
84.10 - 90.62 |
0.9678 times |
Thu 31 July 2025 |
87.21 (2.83%) |
84.94 |
84.16 - 89.44 |
1.1233 times |
Mon 30 June 2025 |
84.81 (4.02%) |
83.06 |
81.65 - 89.43 |
1.4506 times |
Fri 30 May 2025 |
81.53 (1.28%) |
79.84 |
79.84 - 86.45 |
0.8805 times |
Wed 30 April 2025 |
80.50 (-13.86%) |
93.50 |
74.49 - 94.21 |
1.5596 times |
Mon 31 March 2025 |
93.45 (2.69%) |
91.35 |
84.03 - 94.82 |
1.079 times |
Fri 28 February 2025 |
91.00 (3.83%) |
87.63 |
86.83 - 93.02 |
0.8959 times |
DMA SMA EMA moving averages of Energy Select XLE
DMA (daily moving average) of Energy Select XLE
| DMA period | DMA value | | 5 day DMA | 91.19 | | 12 day DMA | 90.18 | | 20 day DMA | 90.25 | | 35 day DMA | 89.05 | | 50 day DMA | 89.02 | | 100 day DMA | 88.19 | | 150 day DMA | 86.89 | | 200 day DMA | 86.84 | EMA (exponential moving average) of Energy Select XLE
| EMA period | EMA current | EMA prev | EMA prev2 | | 5 day EMA | 91.23 | 90.73 | 90.18 | | 12 day EMA | 90.52 | 90.21 | 89.92 | | 20 day EMA | 90.1 | 89.88 | 89.68 | | 35 day EMA | 89.71 | 89.56 | 89.43 | | 50 day EMA | 89.26 | 89.14 | 89.03 |
SMA (simple moving average) of Energy Select XLE
| SMA period | SMA current | SMA prev | SMA prev2 | | 5 day SMA | 91.19 | 90.6 | 89.95 | | 12 day SMA | 90.18 | 90.02 | 90.04 | | 20 day SMA | 90.25 | 90.01 | 89.77 | | 35 day SMA | 89.05 | 88.88 | 88.72 | | 50 day SMA | 89.02 | 88.95 | 88.91 | | 100 day SMA | 88.19 | 88.15 | 88.12 | | 150 day SMA | 86.89 | 86.82 | 86.76 | | 200 day SMA | 86.84 | 86.83 | 86.82 |
|
|
