SpdrS XHB full analysis,charts,indicators,moving averages,SMA,DMA,EMA,ADX,MACD,RSISpdr S XHB WideScreen charts, DMA,SMA,EMA technical analysis, forecast prediction, by indicators ADX,MACD,RSI,CCI AMEX stock exchange
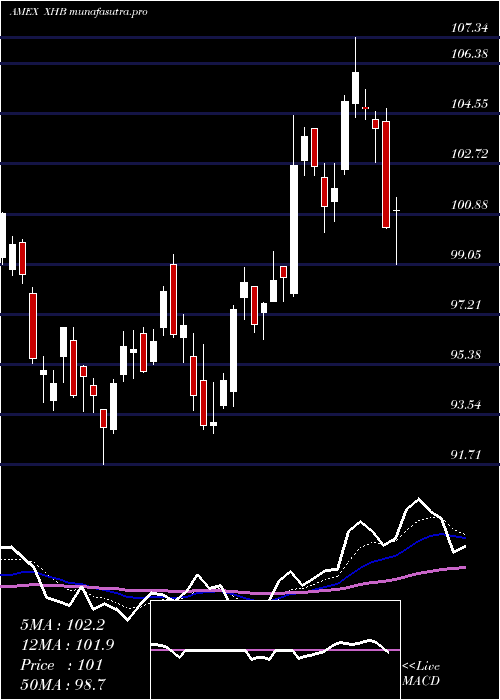
Daily price and charts and targets SpdrS Strong Daily Stock price targets for SpdrS XHB are 107.77 and 109.82 | Daily Target 1 | 107.42 | | Daily Target 2 | 108.11 | | Daily Target 3 | 109.47333333333 | | Daily Target 4 | 110.16 | | Daily Target 5 | 111.52 |
Daily price and volume Spdr S
| Date |
Closing |
Open |
Range |
Volume |
Fri 24 October 2025 |
108.79 (-0.09%) |
109.91 |
108.79 - 110.84 |
1.2784 times |
Thu 23 October 2025 |
108.89 (0.91%) |
108.98 |
107.31 - 109.18 |
0.8681 times |
Wed 22 October 2025 |
107.91 (-2.18%) |
109.81 |
107.76 - 110.35 |
0.678 times |
Tue 21 October 2025 |
110.31 (1.59%) |
107.65 |
107.11 - 110.80 |
1.2011 times |
Mon 20 October 2025 |
108.58 (0.76%) |
108.44 |
108.03 - 109.17 |
0.6722 times |
Fri 17 October 2025 |
107.76 (0.66%) |
106.16 |
105.75 - 108.05 |
0.489 times |
Thu 16 October 2025 |
107.05 (-0.69%) |
107.80 |
106.15 - 108.25 |
0.5415 times |
Wed 15 October 2025 |
107.79 (0.17%) |
108.03 |
107.49 - 109.05 |
1.414 times |
Tue 14 October 2025 |
107.61 (3.14%) |
103.39 |
103.39 - 107.80 |
1.9216 times |
Mon 13 October 2025 |
104.33 (0.59%) |
104.71 |
103.86 - 104.83 |
0.9362 times |
Fri 10 October 2025 |
103.72 (-1.57%) |
105.88 |
103.39 - 106.22 |
1.5302 times |
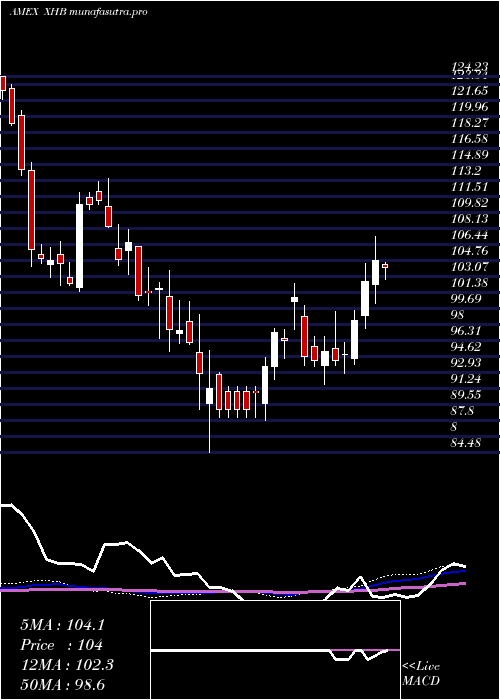
Weekly price and charts SpdrS Strong weekly Stock price targets for SpdrS XHB are 107.95 and 111.68 | Weekly Target 1 | 105.18 | | Weekly Target 2 | 106.99 | | Weekly Target 3 | 108.91333333333 | | Weekly Target 4 | 110.72 | | Weekly Target 5 | 112.64 |
Weekly price and volumes for Spdr S
| Date |
Closing |
Open |
Range |
Volume |
Fri 24 October 2025 |
108.79 (0.96%) |
108.44 |
107.11 - 110.84 |
0.789 times |
Fri 17 October 2025 |
107.76 (3.9%) |
104.71 |
103.39 - 109.05 |
0.8905 times |
Fri 10 October 2025 |
103.72 (-7.49%) |
112.65 |
103.39 - 112.81 |
1.524 times |
Fri 03 October 2025 |
112.12 (1.56%) |
111.11 |
109.32 - 113.05 |
0.8012 times |
Fri 26 September 2025 |
110.40 (-2.32%) |
112.36 |
109.05 - 112.36 |
1.2188 times |
Fri 19 September 2025 |
113.02 (-2.7%) |
116.54 |
112.76 - 118.70 |
1.6488 times |
Fri 12 September 2025 |
116.16 (-2.68%) |
119.62 |
115.16 - 119.67 |
1.2763 times |
Fri 05 September 2025 |
119.36 (4.7%) |
112.07 |
111.76 - 120.58 |
0.883 times |
Fri 29 August 2025 |
114.00 (0%) |
114.51 |
113.35 - 114.75 |
0.1594 times |
Fri 29 August 2025 |
114.00 (-2.56%) |
116.12 |
113.35 - 116.19 |
0.8091 times |
Fri 22 August 2025 |
117.00 (3.23%) |
113.51 |
110.30 - 117.77 |
1.5464 times |
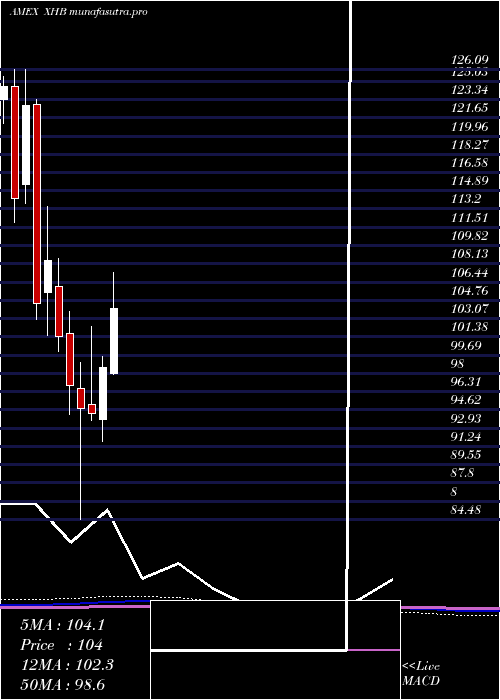
Monthly price and charts SpdrS Strong monthly Stock price targets for SpdrS XHB are 101.26 and 110.92 | Monthly Target 1 | 98.75 | | Monthly Target 2 | 103.77 | | Monthly Target 3 | 108.41 | | Monthly Target 4 | 113.43 | | Monthly Target 5 | 118.07 |
Monthly price and volumes Spdr S
| Date |
Closing |
Open |
Range |
Volume |
Fri 24 October 2025 |
108.79 (-1.81%) |
110.85 |
103.39 - 113.05 |
0.743 times |
Tue 30 September 2025 |
110.80 (-2.81%) |
112.07 |
109.05 - 120.58 |
1.1303 times |
Fri 29 August 2025 |
114.00 (11.86%) |
102.12 |
101.37 - 117.77 |
1.1549 times |
Thu 31 July 2025 |
101.91 (3.39%) |
97.99 |
97.86 - 108.25 |
1.3642 times |
Mon 30 June 2025 |
98.57 (4.57%) |
93.74 |
91.71 - 99.53 |
0.907 times |
Fri 30 May 2025 |
94.26 (-0.46%) |
95.13 |
93.61 - 102.36 |
0.9584 times |
Wed 30 April 2025 |
94.70 (-2.27%) |
96.60 |
84.48 - 99.04 |
0.8888 times |
Mon 31 March 2025 |
96.90 (-4.43%) |
101.70 |
94.19 - 103.73 |
0.9207 times |
Fri 28 February 2025 |
101.39 (-6.47%) |
106.06 |
99.99 - 108.64 |
0.9187 times |
Fri 31 January 2025 |
108.40 (3.73%) |
105.47 |
101.49 - 113.46 |
1.0141 times |
Tue 31 December 2024 |
104.50 (-14.88%) |
122.91 |
102.96 - 123.33 |
0.6242 times |
DMA SMA EMA moving averages of Spdr S XHB
DMA (daily moving average) of Spdr S XHB
| DMA period | DMA value | | 5 day DMA | 108.9 | | 12 day DMA | 107.34 | | 20 day DMA | 108.47 | | 35 day DMA | 110.87 | | 50 day DMA | 111.99 | | 100 day DMA | 107.08 | | 150 day DMA | 102.89 | | 200 day DMA | 103.27 | EMA (exponential moving average) of Spdr S XHB
| EMA period | EMA current | EMA prev | EMA prev2 | | 5 day EMA | 108.61 | 108.52 | 108.33 | | 12 day EMA | 108.39 | 108.32 | 108.22 | | 20 day EMA | 108.89 | 108.9 | 108.9 | | 35 day EMA | 110.12 | 110.2 | 110.28 | | 50 day EMA | 111.71 | 111.83 | 111.95 |
SMA (simple moving average) of Spdr S XHB
| SMA period | SMA current | SMA prev | SMA prev2 | | 5 day SMA | 108.9 | 108.69 | 108.32 | | 12 day SMA | 107.34 | 107.26 | 107.1 | | 20 day SMA | 108.47 | 108.56 | 108.57 | | 35 day SMA | 110.87 | 111.17 | 111.41 | | 50 day SMA | 111.99 | 112.08 | 112.18 | | 100 day SMA | 107.08 | 106.92 | 106.78 | | 150 day SMA | 102.89 | 102.81 | 102.75 | | 200 day SMA | 103.27 | 103.25 | 103.23 |
|
|
