US XDIV full analysis,charts,indicators,moving averages,SMA,DMA,EMA,ADX,MACD,RSIU S XDIV WideScreen charts, DMA,SMA,EMA technical analysis, forecast prediction, by indicators ADX,MACD,RSI,CCI AMEX stock exchange
Daily price and charts and targets US Strong Daily Stock price targets for US XDIV are 27.1 and 27.18 | Daily Target 1 | 27.07 | | Daily Target 2 | 27.12 | | Daily Target 3 | 27.15 | | Daily Target 4 | 27.2 | | Daily Target 5 | 27.23 |
Daily price and volume U S
| Date |
Closing |
Open |
Range |
Volume |
Thu 23 October 2025 |
27.17 (0.74%) |
27.18 |
27.10 - 27.18 |
0.1283 times |
Wed 22 October 2025 |
26.97 (-0.99%) |
27.15 |
26.89 - 27.20 |
0.5264 times |
Tue 21 October 2025 |
27.24 (0.26%) |
27.15 |
27.15 - 27.26 |
2.5169 times |
Mon 20 October 2025 |
27.17 (1.04%) |
27.13 |
27.13 - 27.23 |
1.7269 times |
Fri 17 October 2025 |
26.89 (0.56%) |
26.71 |
26.65 - 26.89 |
0.1902 times |
Thu 16 October 2025 |
26.74 (-0.71%) |
27.01 |
26.69 - 27.09 |
0.4961 times |
Wed 15 October 2025 |
26.93 (0.49%) |
26.96 |
26.76 - 27.14 |
1.1838 times |
Tue 14 October 2025 |
26.80 (-0.22%) |
26.74 |
26.72 - 26.83 |
0.0747 times |
Mon 13 October 2025 |
26.86 (1.59%) |
26.81 |
26.70 - 26.89 |
0.6399 times |
Fri 10 October 2025 |
26.44 (-2.65%) |
27.26 |
26.44 - 27.26 |
2.5169 times |
Thu 09 October 2025 |
27.16 (-0.26%) |
27.22 |
27.13 - 27.22 |
0.4799 times |
Weekly price and charts US Strong weekly Stock price targets for US XDIV are 27.03 and 27.4 | Weekly Target 1 | 26.74 | | Weekly Target 2 | 26.95 | | Weekly Target 3 | 27.106666666667 | | Weekly Target 4 | 27.32 | | Weekly Target 5 | 27.48 |
Weekly price and volumes for U S
| Date |
Closing |
Open |
Range |
Volume |
Thu 23 October 2025 |
27.17 (1.04%) |
27.13 |
26.89 - 27.26 |
1.0045 times |
Fri 17 October 2025 |
26.89 (1.7%) |
26.81 |
26.65 - 27.14 |
0.53 times |
Fri 10 October 2025 |
26.44 (-2.58%) |
27.23 |
26.44 - 27.27 |
1.1396 times |
Fri 03 October 2025 |
27.14 (1.38%) |
26.83 |
26.80 - 27.24 |
0.9418 times |
Fri 26 September 2025 |
26.77 (-0.37%) |
26.85 |
26.47 - 27.00 |
1.5506 times |
Fri 19 September 2025 |
26.87 (1.24%) |
26.59 |
26.45 - 26.93 |
1.8852 times |
Fri 12 September 2025 |
26.54 (1.69%) |
26.22 |
26.10 - 26.56 |
0.2931 times |
Fri 05 September 2025 |
26.10 (0.35%) |
25.75 |
25.65 - 26.33 |
1.4609 times |
Fri 29 August 2025 |
26.01 (0%) |
26.11 |
26.00 - 26.11 |
0.3565 times |
Fri 29 August 2025 |
26.01 (-0.04%) |
25.97 |
25.92 - 26.18 |
0.8376 times |
Fri 22 August 2025 |
26.02 (0.23%) |
25.97 |
25.65 - 26.07 |
0.9251 times |
Monthly price and charts US Strong monthly Stock price targets for US XDIV are 26.81 and 27.64 | Monthly Target 1 | 26.13 | | Monthly Target 2 | 26.65 | | Monthly Target 3 | 26.96 | | Monthly Target 4 | 27.48 | | Monthly Target 5 | 27.79 |
Monthly price and volumes U S
| Date |
Closing |
Open |
Range |
Volume |
Thu 23 October 2025 |
27.17 (0.78%) |
26.93 |
26.44 - 27.27 |
1.2486 times |
Tue 30 September 2025 |
26.96 (3.65%) |
25.75 |
25.65 - 27.00 |
2.1634 times |
Fri 29 August 2025 |
26.01 (2.2%) |
25.18 |
25.02 - 26.18 |
1.6033 times |
Thu 31 July 2025 |
25.45 (-75.93%) |
25.29 |
25.08 - 25.85 |
2.2596 times |
Fri 10 December 2021 |
105.73 (1.83%) |
104.49 |
102.09 - 106.61 |
0.385 times |
Tue 30 November 2021 |
103.83 (0.89%) |
103.63 |
102.71 - 106.82 |
0.3541 times |
Fri 29 October 2021 |
102.91 (6.08%) |
97.10 |
95.80 - 103.65 |
0.6228 times |
Thu 30 September 2021 |
97.01 (-4.35%) |
101.73 |
96.14 - 102.38 |
0.6347 times |
Tue 31 August 2021 |
101.42 (2.2%) |
99.32 |
97.38 - 102.25 |
0.359 times |
Fri 30 July 2021 |
99.24 (3.58%) |
96.20 |
95.09 - 100.39 |
0.3695 times |
Wed 30 June 2021 |
95.81 (1.53%) |
94.64 |
93.25 - 96.20 |
0.9318 times |
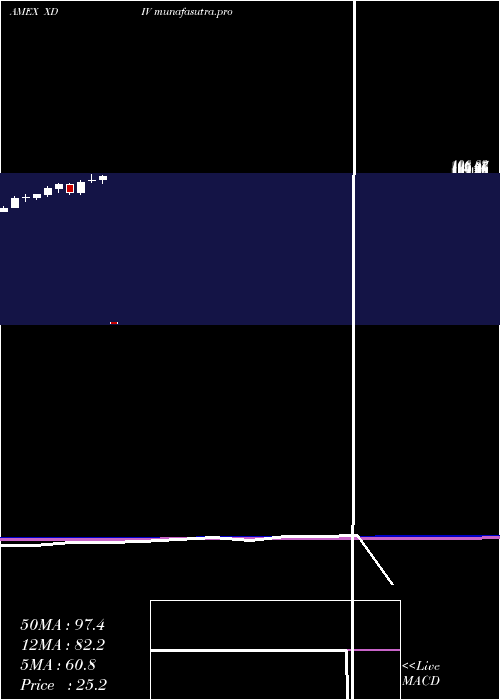
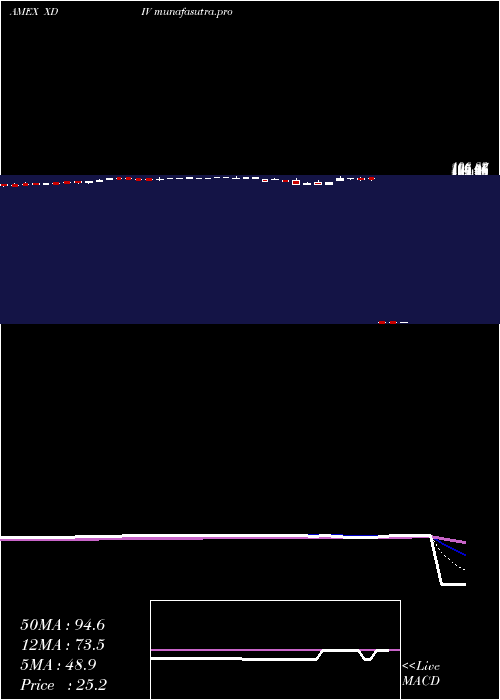
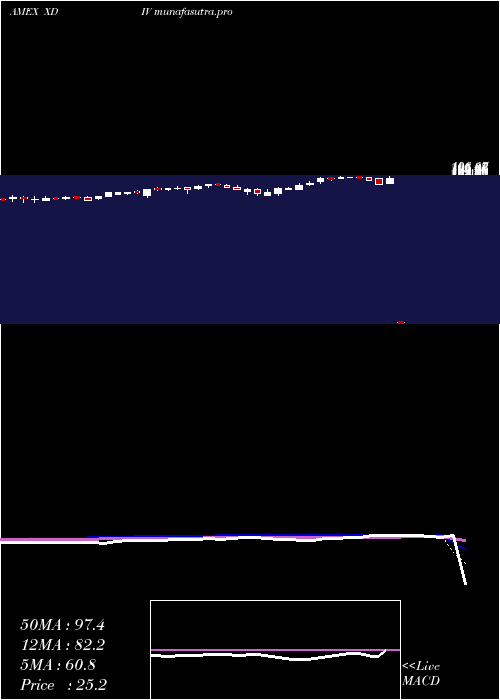
DMA SMA EMA moving averages of U S XDIV
DMA (daily moving average) of U S XDIV
| DMA period | DMA value | | 5 day DMA | 27.09 | | 12 day DMA | 26.97 | | 20 day DMA | 26.99 | | 35 day DMA | 26.81 | | 50 day DMA | 26.55 | | 100 day DMA | 45.94 | | 150 day DMA | 64.07 | | 200 day DMA | 72.67 | EMA (exponential moving average) of U S XDIV
| EMA period | EMA current | EMA prev | EMA prev2 | | 5 day EMA | 27.07 | 27.02 | 27.05 | | 12 day EMA | 27 | 26.97 | 26.97 | | 20 day EMA | 26.93 | 26.91 | 26.9 | | 35 day EMA | 26.75 | 26.72 | 26.7 | | 50 day EMA | 26.56 | 26.53 | 26.51 |
SMA (simple moving average) of U S XDIV
| SMA period | SMA current | SMA prev | SMA prev2 | | 5 day SMA | 27.09 | 27 | 26.99 | | 12 day SMA | 26.97 | 26.96 | 26.98 | | 20 day SMA | 26.99 | 26.96 | 26.95 | | 35 day SMA | 26.81 | 26.78 | 26.75 | | 50 day SMA | 26.55 | 26.53 | 26.51 | | 100 day SMA | 45.94 | 46.72 | 47.51 | | 150 day SMA | 64.07 | 64.56 | 65.06 | | 200 day SMA | 72.67 | 73.01 | 73.34 |
|
|
