InspireInternational WWJD full analysis,charts,indicators,moving averages,SMA,DMA,EMA,ADX,MACD,RSIInspire International WWJD WideScreen charts, DMA,SMA,EMA technical analysis, forecast prediction, by indicators ADX,MACD,RSI,CCI AMEX stock exchange
Daily price and charts and targets InspireInternational Strong Daily Stock price targets for InspireInternational WWJD are 36.01 and 36.08 | Daily Target 1 | 35.96 | | Daily Target 2 | 35.99 | | Daily Target 3 | 36.03 | | Daily Target 4 | 36.06 | | Daily Target 5 | 36.1 |
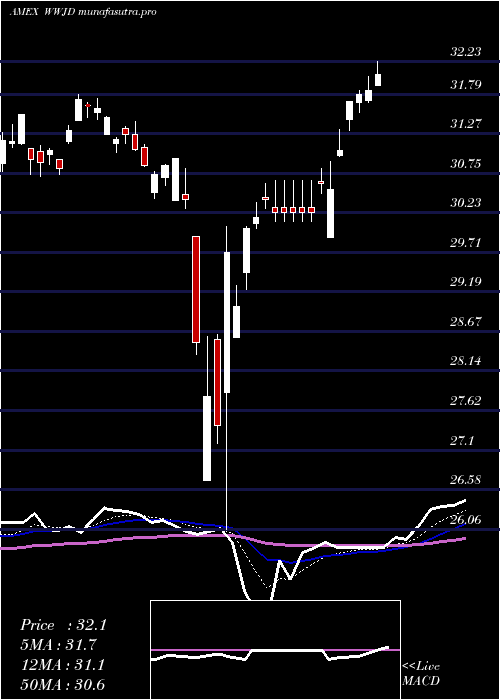
Daily price and volume Inspire International
| Date |
Closing |
Open |
Range |
Volume |
Fri 24 October 2025 |
36.02 (0.28%) |
36.00 |
36.00 - 36.07 |
0.7655 times |
Thu 23 October 2025 |
35.92 (0.81%) |
35.71 |
35.71 - 35.94 |
0.7069 times |
Wed 22 October 2025 |
35.63 (-0.08%) |
35.64 |
35.53 - 35.80 |
0.8269 times |
Tue 21 October 2025 |
35.66 (-0.5%) |
35.30 |
35.30 - 35.79 |
1.4698 times |
Mon 20 October 2025 |
35.84 (0.7%) |
35.67 |
35.67 - 35.87 |
1.2987 times |
Fri 17 October 2025 |
35.59 (0.57%) |
35.43 |
35.38 - 35.63 |
1.4104 times |
Thu 16 October 2025 |
35.39 (0.2%) |
35.41 |
35.39 - 35.66 |
1.1729 times |
Wed 15 October 2025 |
35.32 (0.71%) |
35.27 |
35.17 - 35.40 |
0.8271 times |
Tue 14 October 2025 |
35.07 (-0.28%) |
34.77 |
34.77 - 35.26 |
0.7147 times |
Mon 13 October 2025 |
35.17 (1.21%) |
35.13 |
35.08 - 35.22 |
0.807 times |
Fri 10 October 2025 |
34.75 (-1.56%) |
35.22 |
34.68 - 35.38 |
2.0606 times |
Weekly price and charts InspireInternational Strong weekly Stock price targets for InspireInternational WWJD are 35.66 and 36.43 | Weekly Target 1 | 35.03 | | Weekly Target 2 | 35.52 | | Weekly Target 3 | 35.796666666667 | | Weekly Target 4 | 36.29 | | Weekly Target 5 | 36.57 |
Weekly price and volumes for Inspire International
| Date |
Closing |
Open |
Range |
Volume |
Fri 24 October 2025 |
36.02 (1.21%) |
35.67 |
35.30 - 36.07 |
0.8725 times |
Fri 17 October 2025 |
35.59 (2.42%) |
35.13 |
34.77 - 35.66 |
0.8492 times |
Fri 10 October 2025 |
34.75 (-2.82%) |
35.83 |
34.68 - 35.84 |
1.4901 times |
Fri 03 October 2025 |
35.76 (2.41%) |
35.05 |
35.05 - 35.88 |
1.6566 times |
Fri 26 September 2025 |
34.92 (-1.08%) |
35.30 |
34.79 - 35.58 |
1.9629 times |
Fri 19 September 2025 |
35.30 (-0.23%) |
35.47 |
35.24 - 35.81 |
0.8941 times |
Fri 12 September 2025 |
35.38 (1.2%) |
35.21 |
35.05 - 35.53 |
0.5736 times |
Fri 05 September 2025 |
34.96 (0.06%) |
34.62 |
34.27 - 35.19 |
0.9681 times |
Fri 29 August 2025 |
34.94 (0%) |
34.96 |
34.80 - 34.97 |
0.1608 times |
Fri 29 August 2025 |
34.94 (-1.55%) |
35.30 |
34.75 - 35.46 |
0.5721 times |
Fri 22 August 2025 |
35.49 (1.55%) |
34.95 |
34.82 - 35.58 |
1.2365 times |
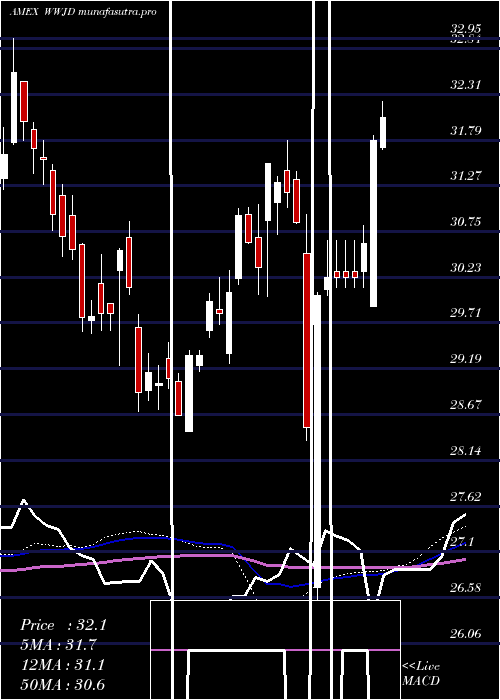
Monthly price and charts InspireInternational Strong monthly Stock price targets for InspireInternational WWJD are 35.35 and 36.74 | Monthly Target 1 | 34.2 | | Monthly Target 2 | 35.11 | | Monthly Target 3 | 35.59 | | Monthly Target 4 | 36.5 | | Monthly Target 5 | 36.98 |
Monthly price and volumes Inspire International
| Date |
Closing |
Open |
Range |
Volume |
Fri 24 October 2025 |
36.02 (2.13%) |
35.42 |
34.68 - 36.07 |
0.8403 times |
Tue 30 September 2025 |
35.27 (0.94%) |
34.62 |
34.27 - 35.81 |
0.9059 times |
Fri 29 August 2025 |
34.94 (3.31%) |
33.68 |
33.59 - 35.58 |
0.7543 times |
Thu 31 July 2025 |
33.82 (-1.31%) |
34.32 |
33.78 - 35.50 |
0.8918 times |
Mon 30 June 2025 |
34.27 (2.39%) |
33.61 |
31.71 - 34.63 |
1.4786 times |
Fri 30 May 2025 |
33.47 (4.43%) |
32.12 |
32.00 - 33.78 |
0.9063 times |
Wed 30 April 2025 |
32.05 (4.26%) |
30.70 |
26.06 - 32.23 |
1.1358 times |
Mon 31 March 2025 |
30.74 (1.32%) |
30.88 |
30.01 - 31.79 |
0.527 times |
Fri 28 February 2025 |
30.34 (1.74%) |
29.36 |
29.25 - 31.06 |
0.5932 times |
Fri 31 January 2025 |
29.82 (2.83%) |
29.06 |
28.48 - 30.23 |
1.9669 times |
Tue 31 December 2024 |
29.00 (-2.75%) |
30.31 |
28.70 - 30.86 |
0.4914 times |

DMA SMA EMA moving averages of Inspire International WWJD
DMA (daily moving average) of Inspire International WWJD
| DMA period | DMA value | | 5 day DMA | 35.81 | | 12 day DMA | 35.47 | | 20 day DMA | 35.49 | | 35 day DMA | 35.4 | | 50 day DMA | 35.27 | | 100 day DMA | 34.81 | | 150 day DMA | 33.74 | | 200 day DMA | 32.9 | EMA (exponential moving average) of Inspire International WWJD
| EMA period | EMA current | EMA prev | EMA prev2 | | 5 day EMA | 35.81 | 35.7 | 35.59 | | 12 day EMA | 35.63 | 35.56 | 35.49 | | 20 day EMA | 35.53 | 35.48 | 35.43 | | 35 day EMA | 35.38 | 35.34 | 35.31 | | 50 day EMA | 35.3 | 35.27 | 35.24 |
SMA (simple moving average) of Inspire International WWJD
| SMA period | SMA current | SMA prev | SMA prev2 | | 5 day SMA | 35.81 | 35.73 | 35.62 | | 12 day SMA | 35.47 | 35.43 | 35.4 | | 20 day SMA | 35.49 | 35.43 | 35.38 | | 35 day SMA | 35.4 | 35.37 | 35.34 | | 50 day SMA | 35.27 | 35.25 | 35.23 | | 100 day SMA | 34.81 | 34.79 | 34.76 | | 150 day SMA | 33.74 | 33.71 | 33.68 | | 200 day SMA | 32.9 | 32.86 | 32.83 |
|
|
