WesternCopper WRN full analysis,charts,indicators,moving averages,SMA,DMA,EMA,ADX,MACD,RSIWestern Copper WRN WideScreen charts, DMA,SMA,EMA technical analysis, forecast prediction, by indicators ADX,MACD,RSI,CCI AMEX stock exchange
Daily price and charts and targets WesternCopper Strong Daily Stock price targets for WesternCopper WRN are 2.14 and 2.21 | Daily Target 1 | 2.08 | | Daily Target 2 | 2.12 | | Daily Target 3 | 2.1533333333333 | | Daily Target 4 | 2.19 | | Daily Target 5 | 2.22 |
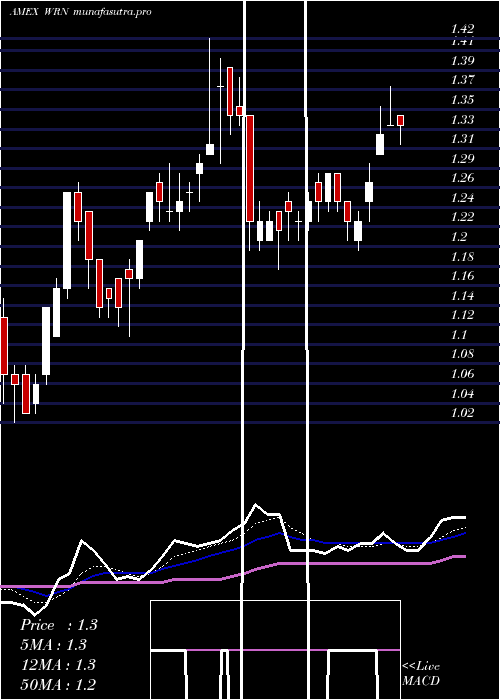
Daily price and volume Western Copper
| Date |
Closing |
Open |
Range |
Volume |
Fri 24 October 2025 |
2.15 (0.47%) |
2.14 |
2.12 - 2.19 |
0.4613 times |
Thu 23 October 2025 |
2.14 (3.38%) |
2.03 |
2.02 - 2.18 |
0.6622 times |
Wed 22 October 2025 |
2.07 (-2.36%) |
2.02 |
2.00 - 2.14 |
1.0275 times |
Tue 21 October 2025 |
2.12 (-6.19%) |
2.18 |
2.07 - 2.18 |
0.9197 times |
Mon 20 October 2025 |
2.26 (4.63%) |
2.27 |
2.20 - 2.29 |
0.5358 times |
Fri 17 October 2025 |
2.16 (-12.55%) |
2.39 |
2.16 - 2.44 |
1.8043 times |
Thu 16 October 2025 |
2.47 (0%) |
2.49 |
2.40 - 2.56 |
1.7949 times |
Wed 15 October 2025 |
2.47 (4.66%) |
2.43 |
2.35 - 2.47 |
1.2554 times |
Tue 14 October 2025 |
2.36 (3.51%) |
2.23 |
2.16 - 2.39 |
0.957 times |
Mon 13 October 2025 |
2.28 (5.07%) |
2.26 |
2.26 - 2.35 |
0.5818 times |
Tue 07 October 2025 |
2.17 (1.4%) |
2.24 |
2.11 - 2.25 |
1.0538 times |
Weekly price and charts WesternCopper Strong weekly Stock price targets for WesternCopper WRN are 1.93 and 2.22 | Weekly Target 1 | 1.86 | | Weekly Target 2 | 2 | | Weekly Target 3 | 2.1466666666667 | | Weekly Target 4 | 2.29 | | Weekly Target 5 | 2.44 |
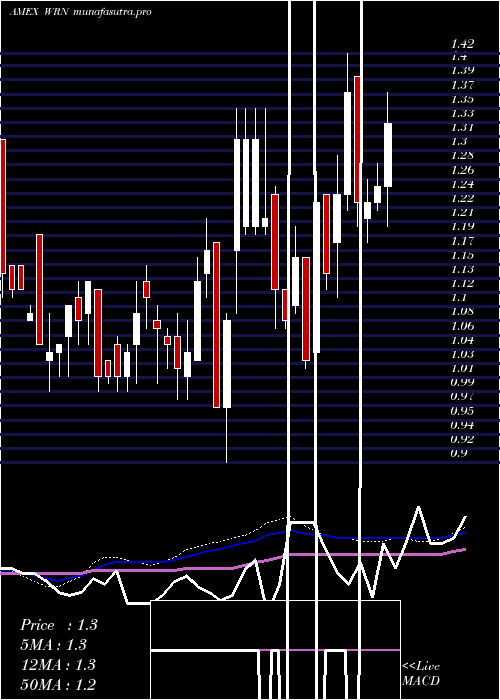
Weekly price and volumes for Western Copper
| Date |
Closing |
Open |
Range |
Volume |
Fri 24 October 2025 |
2.15 (-0.46%) |
2.27 |
2.00 - 2.29 |
1.4303 times |
Fri 17 October 2025 |
2.16 (-0.46%) |
2.26 |
2.16 - 2.56 |
2.5355 times |
Tue 07 October 2025 |
2.17 (8.5%) |
2.04 |
1.99 - 2.25 |
0.8012 times |
Fri 03 October 2025 |
2.00 (1.01%) |
2.02 |
1.87 - 2.06 |
1.2148 times |
Fri 26 September 2025 |
1.98 (12.5%) |
1.80 |
1.78 - 2.00 |
1.0874 times |
Fri 19 September 2025 |
1.76 (5.39%) |
1.68 |
1.60 - 1.81 |
0.7807 times |
Fri 12 September 2025 |
1.67 (10.6%) |
1.55 |
1.49 - 1.67 |
0.8378 times |
Fri 05 September 2025 |
1.51 (7.09%) |
1.41 |
1.40 - 1.58 |
0.5911 times |
Fri 29 August 2025 |
1.41 (0%) |
1.40 |
1.38 - 1.43 |
0.1397 times |
Fri 29 August 2025 |
1.41 (6.82%) |
1.33 |
1.31 - 1.44 |
0.5815 times |
Fri 22 August 2025 |
1.32 (-2.22%) |
1.28 |
1.23 - 1.35 |
0.3725 times |
Monthly price and charts WesternCopper Strong monthly Stock price targets for WesternCopper WRN are 2.01 and 2.7 | Monthly Target 1 | 1.5 | | Monthly Target 2 | 1.83 | | Monthly Target 3 | 2.1933333333333 | | Monthly Target 4 | 2.52 | | Monthly Target 5 | 2.88 |
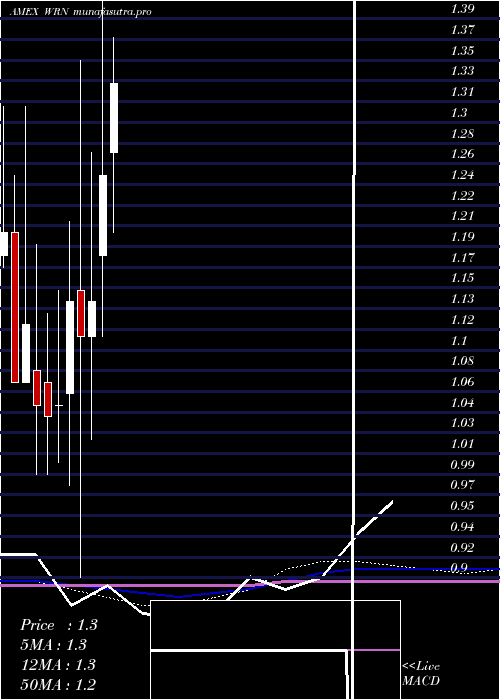
Monthly price and volumes Western Copper
| Date |
Closing |
Open |
Range |
Volume |
Fri 24 October 2025 |
2.15 (9.14%) |
1.99 |
1.87 - 2.56 |
2.1097 times |
Tue 30 September 2025 |
1.97 (39.72%) |
1.41 |
1.40 - 2.05 |
1.4748 times |
Fri 29 August 2025 |
1.41 (14.63%) |
1.23 |
1.18 - 1.44 |
0.9397 times |
Thu 31 July 2025 |
1.23 (-1.6%) |
1.27 |
1.20 - 1.38 |
0.8406 times |
Mon 30 June 2025 |
1.25 (9.65%) |
1.18 |
1.11 - 1.42 |
0.7181 times |
Fri 30 May 2025 |
1.14 (2.7%) |
1.11 |
1.02 - 1.27 |
1.1218 times |
Wed 30 April 2025 |
1.11 (-2.63%) |
1.15 |
0.90 - 1.35 |
0.9135 times |
Mon 31 March 2025 |
1.14 (8.57%) |
1.06 |
0.98 - 1.21 |
0.5085 times |
Fri 28 February 2025 |
1.05 (0.96%) |
1.05 |
1.00 - 1.15 |
0.7571 times |
Fri 31 January 2025 |
1.04 (-0.95%) |
1.07 |
0.99 - 1.13 |
0.6162 times |
Tue 31 December 2024 |
1.05 (-6.25%) |
1.08 |
0.99 - 1.19 |
0.4621 times |
DMA SMA EMA moving averages of Western Copper WRN
DMA (daily moving average) of Western Copper WRN
| DMA period | DMA value | | 5 day DMA | 2.15 | | 12 day DMA | 2.23 | | 20 day DMA | 2.11 | | 35 day DMA | 1.91 | | 50 day DMA | 1.74 | | 100 day DMA | 1.5 | | 150 day DMA | 1.38 | | 200 day DMA | 1.3 | EMA (exponential moving average) of Western Copper WRN
| EMA period | EMA current | EMA prev | EMA prev2 | | 5 day EMA | 2.16 | 2.17 | 2.18 | | 12 day EMA | 2.15 | 2.15 | 2.15 | | 20 day EMA | 2.09 | 2.08 | 2.07 | | 35 day EMA | 1.93 | 1.92 | 1.91 | | 50 day EMA | 1.74 | 1.72 | 1.7 |
SMA (simple moving average) of Western Copper WRN
| SMA period | SMA current | SMA prev | SMA prev2 | | 5 day SMA | 2.15 | 2.15 | 2.22 | | 12 day SMA | 2.23 | 2.22 | 2.2 | | 20 day SMA | 2.11 | 2.1 | 2.08 | | 35 day SMA | 1.91 | 1.89 | 1.87 | | 50 day SMA | 1.74 | 1.72 | 1.7 | | 100 day SMA | 1.5 | 1.49 | 1.48 | | 150 day SMA | 1.38 | 1.37 | 1.36 | | 200 day SMA | 1.3 | 1.29 | 1.29 |
|
|
