GrowthEtf VUG full analysis,charts,indicators,moving averages,SMA,DMA,EMA,ADX,MACD,RSIGrowth Etf VUG WideScreen charts, DMA,SMA,EMA technical analysis, forecast prediction, by indicators ADX,MACD,RSI,CCI AMEX stock exchange
Daily price and charts and targets GrowthEtf Strong Daily Stock price targets for GrowthEtf VUG are 482.79 and 487.75 | Daily Target 1 | 478.81 | | Daily Target 2 | 481.8 | | Daily Target 3 | 483.76666666667 | | Daily Target 4 | 486.76 | | Daily Target 5 | 488.73 |
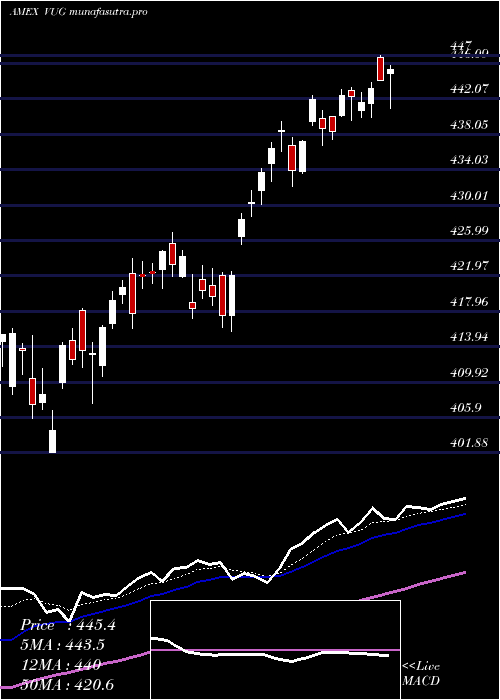
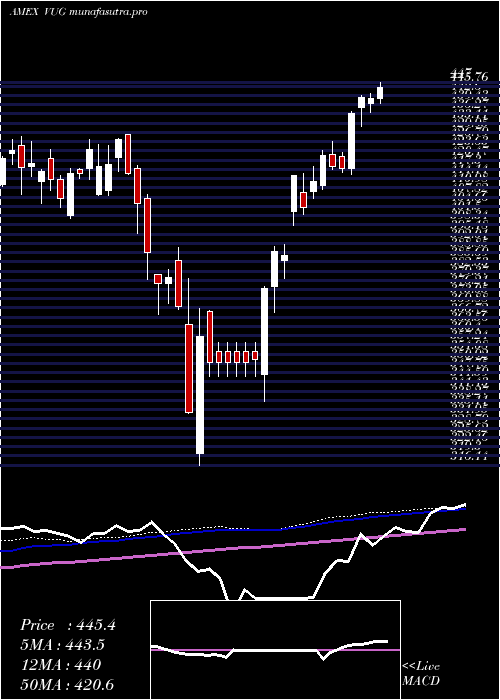
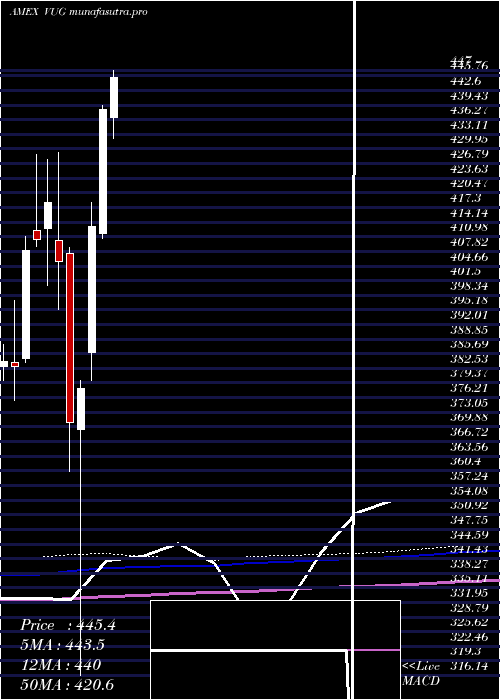
Daily price and volume Growth Etf
| Date |
Closing |
Open |
Range |
Volume |
Thu 23 October 2025 |
484.80 (0.79%) |
481.95 |
480.77 - 485.73 |
0.6627 times |
Wed 22 October 2025 |
481.00 (-0.72%) |
485.03 |
476.77 - 485.53 |
1.3423 times |
Tue 21 October 2025 |
484.49 (-0.01%) |
484.45 |
483.08 - 485.57 |
0.8204 times |
Mon 20 October 2025 |
484.55 (1.32%) |
481.44 |
480.95 - 485.45 |
0.6239 times |
Fri 17 October 2025 |
478.24 (0.45%) |
473.79 |
472.62 - 479.56 |
1.0912 times |
Thu 16 October 2025 |
476.08 (-0.5%) |
480.22 |
472.70 - 482.36 |
1.0454 times |
Wed 15 October 2025 |
478.48 (0.54%) |
480.48 |
473.66 - 482.25 |
1.0208 times |
Tue 14 October 2025 |
475.89 (-0.78%) |
474.21 |
469.81 - 479.37 |
1.3004 times |
Mon 13 October 2025 |
479.63 (-0.51%) |
478.17 |
476.00 - 480.36 |
0.9115 times |
Tue 07 October 2025 |
482.11 (-0.6%) |
485.72 |
480.52 - 485.90 |
1.1814 times |
Mon 06 October 2025 |
485.01 (0.74%) |
482.50 |
482.28 - 486.08 |
0.7293 times |
Weekly price and charts GrowthEtf Strong weekly Stock price targets for GrowthEtf VUG are 480.79 and 489.75 | Weekly Target 1 | 473.47 | | Weekly Target 2 | 479.14 | | Weekly Target 3 | 482.43333333333 | | Weekly Target 4 | 488.1 | | Weekly Target 5 | 491.39 |
Weekly price and volumes for Growth Etf
| Date |
Closing |
Open |
Range |
Volume |
Thu 23 October 2025 |
484.80 (1.37%) |
481.44 |
476.77 - 485.73 |
0.8081 times |
Fri 17 October 2025 |
478.24 (-0.8%) |
478.17 |
469.81 - 482.36 |
1.2579 times |
Tue 07 October 2025 |
482.11 (0.14%) |
482.50 |
480.52 - 486.08 |
0.4476 times |
Fri 03 October 2025 |
481.44 (1.05%) |
478.32 |
475.91 - 484.77 |
1.9669 times |
Fri 26 September 2025 |
476.43 (-0.83%) |
479.58 |
470.39 - 484.21 |
1.0614 times |
Fri 19 September 2025 |
480.42 (1.89%) |
473.37 |
469.25 - 480.78 |
1.1346 times |
Fri 12 September 2025 |
471.51 (1.93%) |
464.94 |
464.36 - 472.54 |
1.1401 times |
Fri 05 September 2025 |
462.60 (0.87%) |
451.59 |
449.67 - 467.50 |
1.077 times |
Fri 29 August 2025 |
458.62 (0%) |
462.48 |
457.50 - 462.48 |
0.1827 times |
Fri 29 August 2025 |
458.62 (0.04%) |
457.45 |
456.51 - 464.85 |
0.9237 times |
Fri 22 August 2025 |
458.42 (-0.79%) |
461.48 |
447.26 - 462.44 |
1.3194 times |
Monthly price and charts GrowthEtf Strong monthly Stock price targets for GrowthEtf VUG are 477.31 and 493.58 | Monthly Target 1 | 463.96 | | Monthly Target 2 | 474.38 | | Monthly Target 3 | 480.23 | | Monthly Target 4 | 490.65 | | Monthly Target 5 | 496.5 |
Monthly price and volumes Growth Etf
| Date |
Closing |
Open |
Range |
Volume |
Thu 23 October 2025 |
484.80 (1.08%) |
477.38 |
469.81 - 486.08 |
0.4869 times |
Tue 30 September 2025 |
479.61 (4.58%) |
451.59 |
449.67 - 484.21 |
0.8824 times |
Fri 29 August 2025 |
458.62 (0.76%) |
449.03 |
442.97 - 465.63 |
0.7336 times |
Thu 31 July 2025 |
455.18 (3.83%) |
436.76 |
432.12 - 462.85 |
0.8007 times |
Mon 30 June 2025 |
438.40 (6.11%) |
411.76 |
410.52 - 439.42 |
0.7874 times |
Fri 30 May 2025 |
413.14 (9.21%) |
385.92 |
379.85 - 418.34 |
0.88 times |
Wed 30 April 2025 |
378.29 (2.01%) |
369.37 |
316.14 - 379.95 |
1.8689 times |
Mon 31 March 2025 |
370.82 (-8.6%) |
407.38 |
360.17 - 408.66 |
1.4563 times |
Fri 28 February 2025 |
405.73 (-3.02%) |
410.07 |
395.26 - 429.11 |
0.8823 times |
Fri 31 January 2025 |
418.35 (1.93%) |
412.86 |
400.36 - 427.68 |
1.2216 times |
Tue 31 December 2024 |
410.44 (0.58%) |
412.29 |
408.83 - 428.69 |
0.8486 times |
DMA SMA EMA moving averages of Growth Etf VUG
DMA (daily moving average) of Growth Etf VUG
| DMA period | DMA value | | 5 day DMA | 482.62 | | 12 day DMA | 480.98 | | 20 day DMA | 480.06 | | 35 day DMA | 475.71 | | 50 day DMA | 470.83 | | 100 day DMA | 453.79 | | 150 day DMA | 428 | | 200 day DMA | 423.15 | EMA (exponential moving average) of Growth Etf VUG
| EMA period | EMA current | EMA prev | EMA prev2 | | 5 day EMA | 482.58 | 481.47 | 481.7 | | 12 day EMA | 481.06 | 480.38 | 480.27 | | 20 day EMA | 479.37 | 478.8 | 478.57 | | 35 day EMA | 475.07 | 474.5 | 474.12 | | 50 day EMA | 470.78 | 470.21 | 469.77 |
SMA (simple moving average) of Growth Etf VUG
| SMA period | SMA current | SMA prev | SMA prev2 | | 5 day SMA | 482.62 | 480.87 | 480.37 | | 12 day SMA | 480.98 | 480.85 | 480.92 | | 20 day SMA | 480.06 | 480.02 | 479.99 | | 35 day SMA | 475.71 | 474.96 | 474.32 | | 50 day SMA | 470.83 | 470.3 | 469.86 | | 100 day SMA | 453.79 | 453.09 | 452.32 | | 150 day SMA | 428 | 427.25 | 426.58 | | 200 day SMA | 423.15 | 422.84 | 422.51 |
|
|
