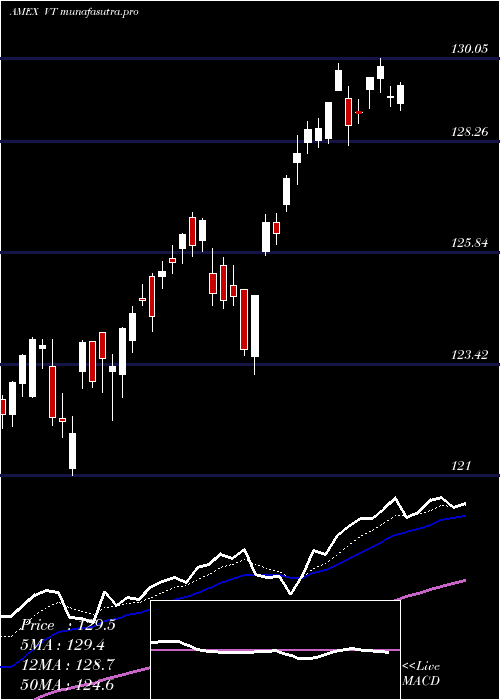
TotalWorld VT full analysis,charts,indicators,moving averages,SMA,DMA,EMA,ADX,MACD,RSITotal World VT WideScreen charts, DMA,SMA,EMA technical analysis, forecast prediction, by indicators ADX,MACD,RSI,CCI AMEX stock exchange
Daily price and charts and targets TotalWorld Strong Daily Stock price targets for TotalWorld VT are 138.95 and 140.08 | Daily Target 1 | 138.05 | | Daily Target 2 | 138.72 | | Daily Target 3 | 139.17666666667 | | Daily Target 4 | 139.85 | | Daily Target 5 | 140.31 |
Daily price and volume Total World
| Date |
Closing |
Open |
Range |
Volume |
Thu 23 October 2025 |
139.40 (0.65%) |
138.94 |
138.50 - 139.63 |
0.3874 times |
Wed 22 October 2025 |
138.50 (-0.42%) |
139.18 |
137.69 - 139.27 |
0.5851 times |
Tue 21 October 2025 |
139.09 (-0.27%) |
139.27 |
138.83 - 139.44 |
0.5456 times |
Mon 20 October 2025 |
139.46 (1%) |
138.28 |
138.13 - 139.63 |
0.6316 times |
Fri 17 October 2025 |
138.08 (0.31%) |
136.00 |
136.00 - 138.38 |
2.0969 times |
Thu 16 October 2025 |
137.65 (-0.27%) |
138.59 |
137.02 - 138.98 |
0.9054 times |
Wed 15 October 2025 |
138.02 (0.56%) |
138.34 |
136.94 - 138.88 |
1.5228 times |
Tue 14 October 2025 |
137.25 (-0.05%) |
136.07 |
135.48 - 137.91 |
1.2414 times |
Mon 13 October 2025 |
137.32 (1.6%) |
136.83 |
136.61 - 137.57 |
0.8113 times |
Fri 10 October 2025 |
135.16 (-2.58%) |
138.83 |
135.11 - 139.07 |
1.2726 times |
Thu 09 October 2025 |
138.74 (-0.52%) |
139.60 |
138.40 - 139.63 |
0.7932 times |
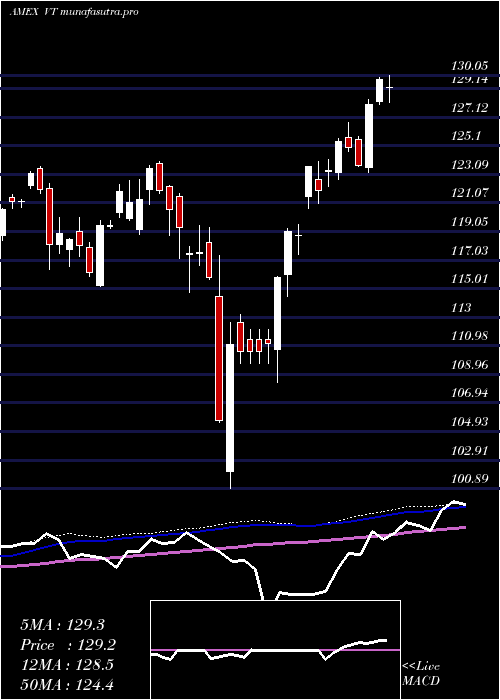
Weekly price and charts TotalWorld Strong weekly Stock price targets for TotalWorld VT are 138.55 and 140.49 | Weekly Target 1 | 136.97 | | Weekly Target 2 | 138.18 | | Weekly Target 3 | 138.90666666667 | | Weekly Target 4 | 140.12 | | Weekly Target 5 | 140.85 |
Weekly price and volumes for Total World
| Date |
Closing |
Open |
Range |
Volume |
Thu 23 October 2025 |
139.40 (0.96%) |
138.28 |
137.69 - 139.63 |
0.5388 times |
Fri 17 October 2025 |
138.08 (2.16%) |
136.83 |
135.48 - 138.98 |
1.6488 times |
Fri 10 October 2025 |
135.16 (-2.82%) |
139.51 |
135.11 - 139.80 |
1.0074 times |
Fri 03 October 2025 |
139.08 (1.62%) |
137.44 |
137.01 - 139.65 |
0.8793 times |
Fri 26 September 2025 |
136.86 (-0.44%) |
137.36 |
135.48 - 138.35 |
1.0968 times |
Fri 19 September 2025 |
137.47 (0.64%) |
137.16 |
136.31 - 138.11 |
1.1613 times |
Fri 12 September 2025 |
136.60 (1.65%) |
134.89 |
134.70 - 136.95 |
0.8155 times |
Fri 05 September 2025 |
134.38 (0.46%) |
132.31 |
131.89 - 135.30 |
1.5149 times |
Fri 29 August 2025 |
133.77 (0%) |
134.03 |
133.43 - 134.10 |
0.3265 times |
Fri 29 August 2025 |
133.77 (-0.51%) |
134.08 |
133.34 - 134.59 |
1.0108 times |
Fri 22 August 2025 |
134.45 (0.8%) |
133.37 |
131.86 - 134.66 |
1.1134 times |
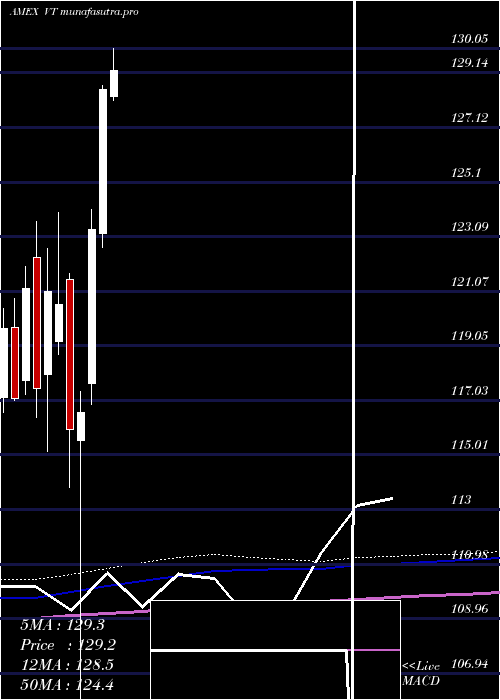
Monthly price and charts TotalWorld Strong monthly Stock price targets for TotalWorld VT are 137.26 and 141.95 | Monthly Target 1 | 133.41 | | Monthly Target 2 | 136.41 | | Monthly Target 3 | 138.10333333333 | | Monthly Target 4 | 141.1 | | Monthly Target 5 | 142.79 |
Monthly price and volumes Total World
| Date |
Closing |
Open |
Range |
Volume |
Thu 23 October 2025 |
139.40 (1.16%) |
137.66 |
135.11 - 139.80 |
0.8574 times |
Tue 30 September 2025 |
137.80 (3.01%) |
132.31 |
131.89 - 138.35 |
1.1907 times |
Fri 29 August 2025 |
133.77 (2.96%) |
129.08 |
127.79 - 134.66 |
1.1113 times |
Thu 31 July 2025 |
129.93 (1.1%) |
128.28 |
128.12 - 132.08 |
1.0394 times |
Mon 30 June 2025 |
128.52 (4.17%) |
123.21 |
122.70 - 128.68 |
0.9346 times |
Fri 30 May 2025 |
123.37 (5.81%) |
117.67 |
116.87 - 124.10 |
0.8824 times |
Wed 30 April 2025 |
116.60 (0.56%) |
115.56 |
100.89 - 117.37 |
1.2592 times |
Mon 31 March 2025 |
115.95 (-3.83%) |
121.49 |
113.83 - 121.74 |
0.751 times |
Fri 28 February 2025 |
120.57 (-0.41%) |
119.22 |
118.75 - 123.98 |
0.7031 times |
Fri 31 January 2025 |
121.07 (3.06%) |
117.98 |
115.14 - 122.66 |
1.2708 times |
Tue 31 December 2024 |
117.48 (-3.05%) |
122.33 |
116.39 - 123.64 |
0.5192 times |
DMA SMA EMA moving averages of Total World VT
DMA (daily moving average) of Total World VT
| DMA period | DMA value | | 5 day DMA | 138.91 | | 12 day DMA | 138.18 | | 20 day DMA | 138.24 | | 35 day DMA | 137.55 | | 50 day DMA | 136.34 | | 100 day DMA | 132.49 | | 150 day DMA | 127.16 | | 200 day DMA | 125.38 | EMA (exponential moving average) of Total World VT
| EMA period | EMA current | EMA prev | EMA prev2 | | 5 day EMA | 138.85 | 138.57 | 138.6 | | 12 day EMA | 138.43 | 138.25 | 138.21 | | 20 day EMA | 138.07 | 137.93 | 137.87 | | 35 day EMA | 137.18 | 137.05 | 136.96 | | 50 day EMA | 136.3 | 136.17 | 136.07 |
SMA (simple moving average) of Total World VT
| SMA period | SMA current | SMA prev | SMA prev2 | | 5 day SMA | 138.91 | 138.56 | 138.46 | | 12 day SMA | 138.18 | 138.12 | 138.21 | | 20 day SMA | 138.24 | 138.08 | 137.99 | | 35 day SMA | 137.55 | 137.4 | 137.25 | | 50 day SMA | 136.34 | 136.22 | 136.12 | | 100 day SMA | 132.49 | 132.33 | 132.18 | | 150 day SMA | 127.16 | 127.02 | 126.89 | | 200 day SMA | 125.38 | 125.27 | 125.18 |
|
|
