FtseAll VSS full analysis,charts,indicators,moving averages,SMA,DMA,EMA,ADX,MACD,RSIFtse All VSS WideScreen charts, DMA,SMA,EMA technical analysis, forecast prediction, by indicators ADX,MACD,RSI,CCI AMEX stock exchange
Daily price and charts and targets FtseAll Strong Daily Stock price targets for FtseAll VSS are 143.15 and 144 | Daily Target 1 | 142.49 | | Daily Target 2 | 142.96 | | Daily Target 3 | 143.33666666667 | | Daily Target 4 | 143.81 | | Daily Target 5 | 144.19 |
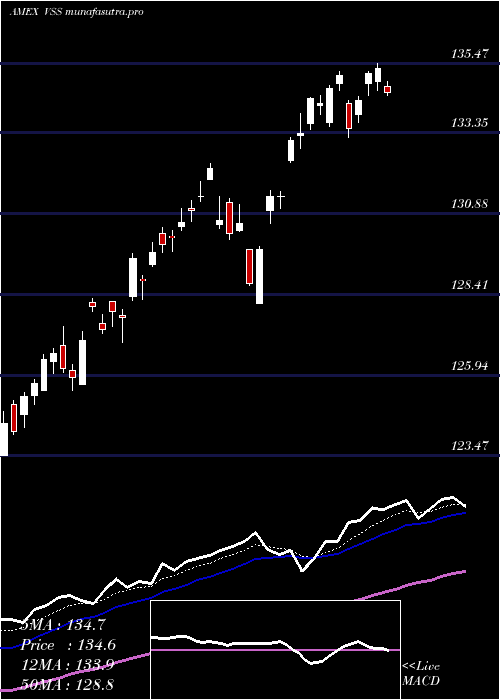
Daily price and volume Ftse All
| Date |
Closing |
Open |
Range |
Volume |
Thu 23 October 2025 |
143.44 (0.77%) |
142.94 |
142.86 - 143.71 |
1.2481 times |
Wed 22 October 2025 |
142.35 (0.35%) |
142.12 |
141.62 - 142.78 |
0.4193 times |
Tue 21 October 2025 |
141.86 (-0.75%) |
142.09 |
141.49 - 142.31 |
0.3501 times |
Mon 20 October 2025 |
142.93 (0.54%) |
141.77 |
141.77 - 143.10 |
1.7571 times |
Fri 17 October 2025 |
142.16 (-0.58%) |
141.89 |
141.33 - 142.31 |
0.4156 times |
Thu 16 October 2025 |
142.99 (0.35%) |
142.96 |
142.43 - 143.59 |
0.9535 times |
Wed 15 October 2025 |
142.49 (0.96%) |
142.37 |
141.54 - 142.63 |
0.8083 times |
Tue 14 October 2025 |
141.14 (-0.37%) |
139.81 |
139.74 - 141.75 |
0.8406 times |
Mon 13 October 2025 |
141.66 (-0.94%) |
141.29 |
141.10 - 141.96 |
2.8165 times |
Tue 07 October 2025 |
143.01 (-0.76%) |
144.05 |
142.93 - 144.09 |
0.3909 times |
Mon 06 October 2025 |
144.10 (0.06%) |
144.02 |
144.02 - 144.63 |
0.2687 times |
Weekly price and charts FtseAll Strong weekly Stock price targets for FtseAll VSS are 142.47 and 144.69 | Weekly Target 1 | 140.66 | | Weekly Target 2 | 142.05 | | Weekly Target 3 | 142.88 | | Weekly Target 4 | 144.27 | | Weekly Target 5 | 145.1 |
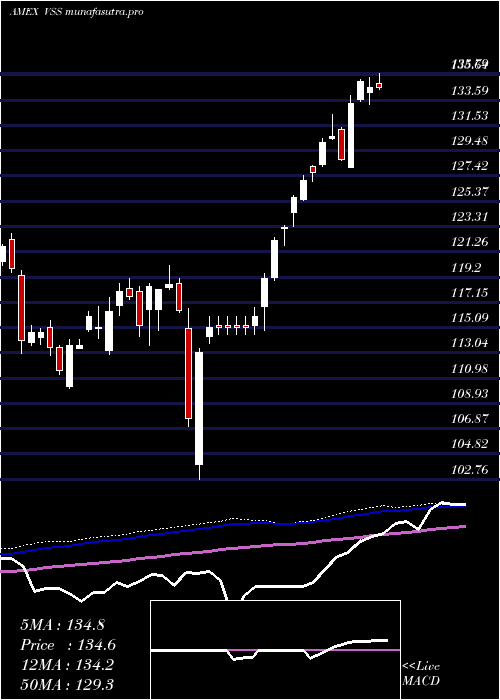
Weekly price and volumes for Ftse All
| Date |
Closing |
Open |
Range |
Volume |
Thu 23 October 2025 |
143.44 (0.9%) |
141.77 |
141.49 - 143.71 |
1.2603 times |
Fri 17 October 2025 |
142.16 (-0.59%) |
141.29 |
139.74 - 143.59 |
1.9481 times |
Tue 07 October 2025 |
143.01 (-0.69%) |
144.02 |
142.93 - 144.63 |
0.2202 times |
Fri 03 October 2025 |
144.01 (1.82%) |
141.91 |
141.91 - 144.30 |
0.7482 times |
Fri 26 September 2025 |
141.44 (-1.23%) |
143.15 |
140.27 - 144.21 |
1.7322 times |
Fri 19 September 2025 |
143.20 (0.03%) |
143.50 |
142.85 - 145.33 |
0.7657 times |
Fri 12 September 2025 |
143.16 (1.63%) |
142.12 |
141.65 - 143.50 |
0.7673 times |
Fri 05 September 2025 |
140.87 (0.43%) |
138.01 |
137.54 - 141.63 |
0.8217 times |
Fri 29 August 2025 |
140.27 (0%) |
140.04 |
139.82 - 140.43 |
0.1371 times |
Fri 29 August 2025 |
140.27 (-0.3%) |
140.36 |
138.90 - 140.73 |
1.5993 times |
Fri 22 August 2025 |
140.69 (1.59%) |
138.85 |
137.68 - 140.96 |
0.945 times |
Monthly price and charts FtseAll Strong monthly Stock price targets for FtseAll VSS are 141.59 and 146.48 | Monthly Target 1 | 137.71 | | Monthly Target 2 | 140.58 | | Monthly Target 3 | 142.60333333333 | | Monthly Target 4 | 145.47 | | Monthly Target 5 | 147.49 |
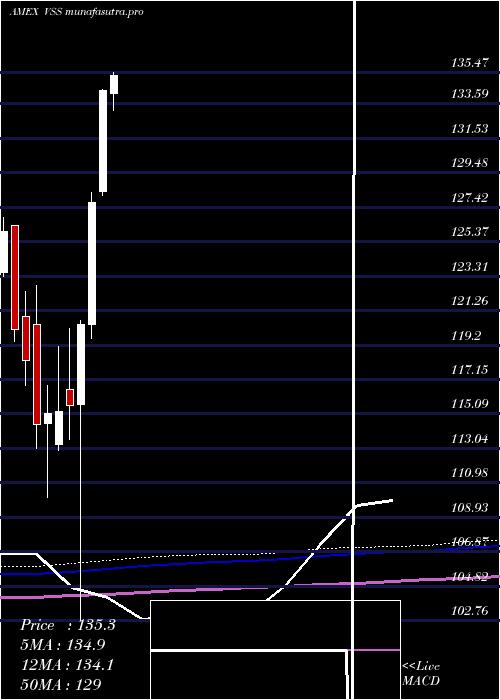
Monthly price and volumes Ftse All
| Date |
Closing |
Open |
Range |
Volume |
Thu 23 October 2025 |
143.44 (0.62%) |
142.87 |
139.74 - 144.63 |
0.5847 times |
Tue 30 September 2025 |
142.55 (1.63%) |
138.01 |
137.54 - 145.33 |
0.6485 times |
Fri 29 August 2025 |
140.27 (4.93%) |
133.57 |
132.84 - 140.96 |
0.6788 times |
Thu 31 July 2025 |
133.68 (-0.53%) |
134.19 |
133.19 - 138.29 |
0.7215 times |
Mon 30 June 2025 |
134.39 (5.25%) |
128.34 |
128.14 - 134.44 |
0.6836 times |
Fri 30 May 2025 |
127.69 (6.04%) |
120.42 |
119.59 - 128.28 |
0.9035 times |
Wed 30 April 2025 |
120.42 (4.17%) |
115.66 |
102.76 - 120.67 |
1.81 times |
Mon 31 March 2025 |
115.60 (0.3%) |
116.54 |
113.60 - 120.16 |
1.1952 times |
Fri 28 February 2025 |
115.25 (0.12%) |
113.24 |
112.88 - 119.11 |
1.3269 times |
Fri 31 January 2025 |
115.11 (0.55%) |
114.50 |
110.11 - 116.77 |
1.4473 times |
Tue 31 December 2024 |
114.48 (-3.22%) |
120.44 |
113.01 - 122.77 |
0.7453 times |
DMA SMA EMA moving averages of Ftse All VSS
DMA (daily moving average) of Ftse All VSS
| DMA period | DMA value | | 5 day DMA | 142.55 | | 12 day DMA | 142.68 | | 20 day DMA | 142.55 | | 35 day DMA | 142.42 | | 50 day DMA | 141.45 | | 100 day DMA | 137.37 | | 150 day DMA | 131.12 | | 200 day DMA | 127.31 | EMA (exponential moving average) of Ftse All VSS
| EMA period | EMA current | EMA prev | EMA prev2 | | 5 day EMA | 142.71 | 142.34 | 142.34 | | 12 day EMA | 142.6 | 142.45 | 142.47 | | 20 day EMA | 142.49 | 142.39 | 142.39 | | 35 day EMA | 141.8 | 141.7 | 141.66 | | 50 day EMA | 141.16 | 141.07 | 141.02 |
SMA (simple moving average) of Ftse All VSS
| SMA period | SMA current | SMA prev | SMA prev2 | | 5 day SMA | 142.55 | 142.46 | 142.49 | | 12 day SMA | 142.68 | 142.65 | 142.7 | | 20 day SMA | 142.55 | 142.56 | 142.6 | | 35 day SMA | 142.42 | 142.33 | 142.27 | | 50 day SMA | 141.45 | 141.32 | 141.22 | | 100 day SMA | 137.37 | 137.22 | 137.06 | | 150 day SMA | 131.12 | 130.96 | 130.8 | | 200 day SMA | 127.31 | 127.16 | 127.03 |
|
|
