EsgIntl VSGX full analysis,charts,indicators,moving averages,SMA,DMA,EMA,ADX,MACD,RSIEsg Intl VSGX WideScreen charts, DMA,SMA,EMA technical analysis, forecast prediction, by indicators ADX,MACD,RSI,CCI AMEX stock exchange
Daily price and charts and targets EsgIntl Strong Daily Stock price targets for EsgIntl VSGX are 70.39 and 71.03 | Daily Target 1 | 69.87 | | Daily Target 2 | 70.27 | | Daily Target 3 | 70.51 | | Daily Target 4 | 70.91 | | Daily Target 5 | 71.15 |
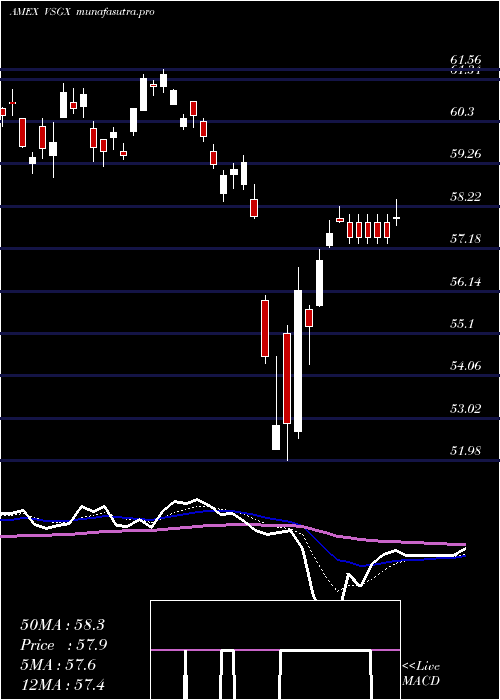
Daily price and volume Esg Intl
| Date |
Closing |
Open |
Range |
Volume |
Thu 23 October 2025 |
70.67 (0.58%) |
70.26 |
70.11 - 70.75 |
1.2456 times |
Wed 22 October 2025 |
70.26 (-0.2%) |
70.35 |
69.97 - 70.58 |
0.9424 times |
Tue 21 October 2025 |
70.40 (-0.87%) |
70.92 |
70.30 - 70.92 |
1.1497 times |
Mon 20 October 2025 |
71.02 (1.1%) |
70.57 |
70.56 - 71.12 |
0.8706 times |
Fri 17 October 2025 |
70.25 (-0.14%) |
69.69 |
69.69 - 70.41 |
0.9936 times |
Thu 16 October 2025 |
70.35 (0.56%) |
70.32 |
70.07 - 70.63 |
0.7371 times |
Wed 15 October 2025 |
69.96 (1.13%) |
69.78 |
69.55 - 70.16 |
1.1576 times |
Tue 14 October 2025 |
69.18 (-0.13%) |
68.67 |
68.64 - 69.53 |
0.8975 times |
Mon 13 October 2025 |
69.27 (-1.3%) |
69.11 |
68.88 - 69.34 |
0.9443 times |
Tue 07 October 2025 |
70.18 (-0.88%) |
70.64 |
70.18 - 70.73 |
1.0615 times |
Mon 06 October 2025 |
70.80 (0.23%) |
70.76 |
70.66 - 70.94 |
0.8384 times |
Weekly price and charts EsgIntl Strong weekly Stock price targets for EsgIntl VSGX are 70.32 and 71.47 | Weekly Target 1 | 69.44 | | Weekly Target 2 | 70.05 | | Weekly Target 3 | 70.586666666667 | | Weekly Target 4 | 71.2 | | Weekly Target 5 | 71.74 |
Weekly price and volumes for Esg Intl
| Date |
Closing |
Open |
Range |
Volume |
Thu 23 October 2025 |
70.67 (0.6%) |
70.57 |
69.97 - 71.12 |
0.7736 times |
Fri 17 October 2025 |
70.25 (0.1%) |
69.11 |
68.64 - 70.63 |
0.8696 times |
Tue 07 October 2025 |
70.18 (-0.65%) |
70.76 |
70.18 - 70.94 |
0.3493 times |
Fri 03 October 2025 |
70.64 (3.09%) |
68.97 |
68.84 - 70.71 |
0.8009 times |
Fri 26 September 2025 |
68.52 (-1.03%) |
69.30 |
68.06 - 69.73 |
2.6372 times |
Fri 19 September 2025 |
69.23 (-0.01%) |
69.56 |
69.06 - 70.25 |
1.2156 times |
Fri 12 September 2025 |
69.24 (1.82%) |
68.30 |
68.22 - 69.47 |
1.0882 times |
Fri 05 September 2025 |
68.00 (0.8%) |
67.24 |
66.54 - 68.30 |
0.7955 times |
Fri 29 August 2025 |
67.46 (0%) |
67.41 |
67.34 - 67.77 |
0.206 times |
Fri 29 August 2025 |
67.46 (-1.7%) |
68.30 |
67.20 - 68.46 |
1.2641 times |
Fri 22 August 2025 |
68.63 (1.25%) |
67.61 |
67.34 - 69.00 |
0.8524 times |

Monthly price and charts EsgIntl Strong monthly Stock price targets for EsgIntl VSGX are 69.66 and 72.14 | Monthly Target 1 | 67.66 | | Monthly Target 2 | 69.17 | | Monthly Target 3 | 70.143333333333 | | Monthly Target 4 | 71.65 | | Monthly Target 5 | 72.62 |
Monthly price and volumes Esg Intl
| Date |
Closing |
Open |
Range |
Volume |
Thu 23 October 2025 |
70.67 (1.87%) |
69.67 |
68.64 - 71.12 |
0.4515 times |
Tue 30 September 2025 |
69.37 (2.83%) |
67.24 |
66.54 - 70.25 |
1.1114 times |
Fri 29 August 2025 |
67.46 (4.12%) |
64.69 |
64.16 - 69.00 |
0.9082 times |
Thu 31 July 2025 |
64.79 (-1.08%) |
65.37 |
64.64 - 67.15 |
1.0578 times |
Mon 30 June 2025 |
65.50 (3.02%) |
63.86 |
62.53 - 65.58 |
1.5665 times |
Fri 30 May 2025 |
63.58 (4.71%) |
60.85 |
60.36 - 64.30 |
1.0109 times |
Wed 30 April 2025 |
60.72 (2.95%) |
58.99 |
51.98 - 60.81 |
1.1165 times |
Mon 31 March 2025 |
58.98 (-0.71%) |
60.16 |
58.33 - 61.56 |
0.6977 times |
Fri 28 February 2025 |
59.40 (1.69%) |
57.45 |
57.10 - 61.09 |
0.9454 times |
Fri 31 January 2025 |
58.41 (3.02%) |
56.63 |
54.96 - 59.36 |
1.1341 times |
Tue 31 December 2024 |
56.70 (-2.16%) |
59.02 |
56.08 - 60.19 |
1.1546 times |

DMA SMA EMA moving averages of Esg Intl VSGX
DMA (daily moving average) of Esg Intl VSGX
| DMA period | DMA value | | 5 day DMA | 70.52 | | 12 day DMA | 70.25 | | 20 day DMA | 69.82 | | 35 day DMA | 69.38 | | 50 day DMA | 68.88 | | 100 day DMA | 67.02 | | 150 day DMA | 64.64 | | 200 day DMA | 63.2 | EMA (exponential moving average) of Esg Intl VSGX
| EMA period | EMA current | EMA prev | EMA prev2 | | 5 day EMA | 70.46 | 70.35 | 70.39 | | 12 day EMA | 70.2 | 70.11 | 70.08 | | 20 day EMA | 69.92 | 69.84 | 69.8 | | 35 day EMA | 69.34 | 69.26 | 69.2 | | 50 day EMA | 68.83 | 68.75 | 68.69 |
SMA (simple moving average) of Esg Intl VSGX
| SMA period | SMA current | SMA prev | SMA prev2 | | 5 day SMA | 70.52 | 70.46 | 70.4 | | 12 day SMA | 70.25 | 70.2 | 70.17 | | 20 day SMA | 69.82 | 69.76 | 69.71 | | 35 day SMA | 69.38 | 69.29 | 69.21 | | 50 day SMA | 68.88 | 68.8 | 68.73 | | 100 day SMA | 67.02 | 66.96 | 66.89 | | 150 day SMA | 64.64 | 64.57 | 64.51 | | 200 day SMA | 63.2 | 63.13 | 63.06 |
|
|
