UtilitiesEtf VPU full analysis,charts,indicators,moving averages,SMA,DMA,EMA,ADX,MACD,RSIUtilities Etf VPU WideScreen charts, DMA,SMA,EMA technical analysis, forecast prediction, by indicators ADX,MACD,RSI,CCI AMEX stock exchange
Daily price and charts and targets UtilitiesEtf Strong Daily Stock price targets for UtilitiesEtf VPU are 193.91 and 196.45 | Daily Target 1 | 193.31 | | Daily Target 2 | 194.5 | | Daily Target 3 | 195.85 | | Daily Target 4 | 197.04 | | Daily Target 5 | 198.39 |
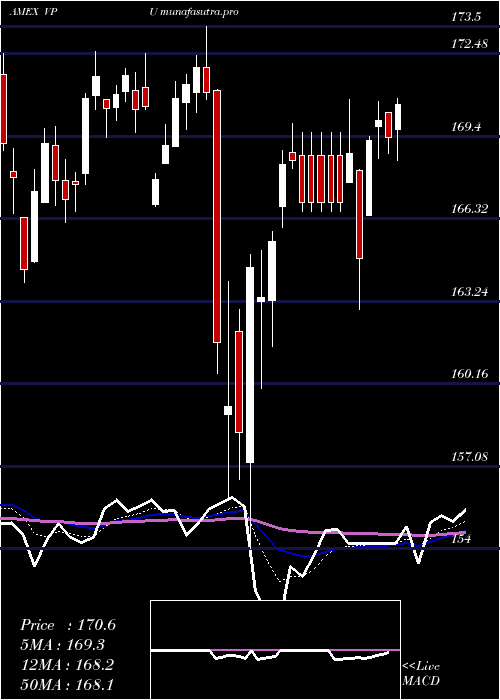
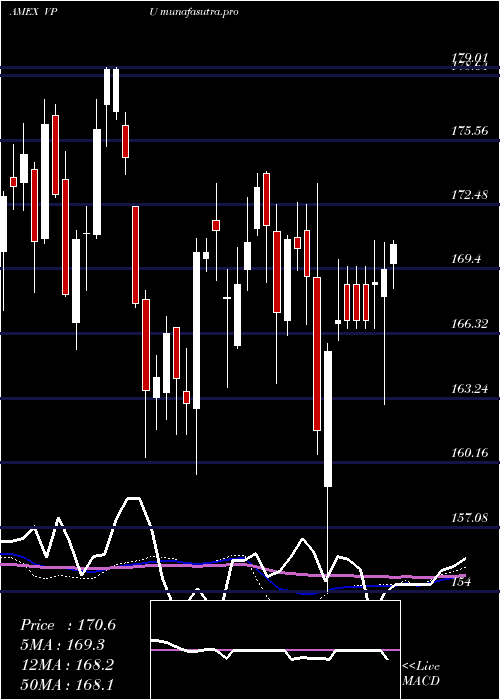
Daily price and volume Utilities Etf
| Date |
Closing |
Open |
Range |
Volume |
Thu 23 October 2025 |
195.69 (-0.01%) |
197.20 |
194.66 - 197.20 |
0.6892 times |
Wed 22 October 2025 |
195.71 (-0.37%) |
196.53 |
194.69 - 196.80 |
1.155 times |
Tue 21 October 2025 |
196.44 (-1.14%) |
199.00 |
195.56 - 199.18 |
1.1642 times |
Mon 20 October 2025 |
198.70 (0.01%) |
200.20 |
198.00 - 200.58 |
1.0526 times |
Fri 17 October 2025 |
198.69 (-0.32%) |
199.60 |
197.77 - 199.99 |
0.942 times |
Thu 16 October 2025 |
199.33 (-1.05%) |
202.15 |
199.31 - 203.15 |
1.069 times |
Wed 15 October 2025 |
201.45 (1.24%) |
200.12 |
199.79 - 202.08 |
1.4184 times |
Tue 14 October 2025 |
198.99 (0.87%) |
196.92 |
196.62 - 199.66 |
0.8191 times |
Mon 13 October 2025 |
197.28 (0.91%) |
196.01 |
196.01 - 198.15 |
0.807 times |
Tue 07 October 2025 |
195.50 (0.39%) |
195.55 |
194.90 - 196.30 |
0.8835 times |
Mon 06 October 2025 |
194.75 (1%) |
193.77 |
192.83 - 195.74 |
1.2589 times |
Weekly price and charts UtilitiesEtf Strong weekly Stock price targets for UtilitiesEtf VPU are 192.22 and 198.14 | Weekly Target 1 | 191.06 | | Weekly Target 2 | 193.37 | | Weekly Target 3 | 196.97666666667 | | Weekly Target 4 | 199.29 | | Weekly Target 5 | 202.9 |
Weekly price and volumes for Utilities Etf
| Date |
Closing |
Open |
Range |
Volume |
Thu 23 October 2025 |
195.69 (-1.51%) |
200.20 |
194.66 - 200.58 |
1.0071 times |
Fri 17 October 2025 |
198.69 (1.63%) |
196.01 |
196.01 - 203.15 |
1.2537 times |
Tue 07 October 2025 |
195.50 (1.38%) |
193.77 |
192.83 - 196.30 |
0.5313 times |
Fri 03 October 2025 |
192.83 (2.43%) |
188.58 |
187.04 - 194.45 |
0.9 times |
Fri 26 September 2025 |
188.25 (1.81%) |
184.72 |
184.38 - 188.36 |
1.1523 times |
Fri 19 September 2025 |
184.91 (-0.14%) |
185.49 |
182.00 - 186.53 |
1.4102 times |
Fri 12 September 2025 |
185.17 (2.26%) |
181.21 |
178.51 - 185.65 |
1.3555 times |
Fri 05 September 2025 |
181.07 (-0.89%) |
181.75 |
179.60 - 183.20 |
1.0452 times |
Fri 29 August 2025 |
182.69 (0%) |
183.59 |
182.48 - 183.64 |
0.2234 times |
Fri 29 August 2025 |
182.69 (-1.86%) |
185.62 |
182.48 - 185.99 |
1.1214 times |
Fri 22 August 2025 |
186.15 (0.5%) |
185.40 |
184.07 - 187.35 |
0.8589 times |
Monthly price and charts UtilitiesEtf Strong monthly Stock price targets for UtilitiesEtf VPU are 192.47 and 206.37 | Monthly Target 1 | 182.13 | | Monthly Target 2 | 188.91 | | Monthly Target 3 | 196.03 | | Monthly Target 4 | 202.81 | | Monthly Target 5 | 209.93 |
Monthly price and volumes Utilities Etf
| Date |
Closing |
Open |
Range |
Volume |
Thu 23 October 2025 |
195.69 (3.32%) |
189.62 |
189.25 - 203.15 |
0.5824 times |
Tue 30 September 2025 |
189.41 (3.68%) |
181.75 |
178.51 - 189.93 |
0.9512 times |
Fri 29 August 2025 |
182.69 (-1.38%) |
184.72 |
182.48 - 189.30 |
1.0401 times |
Thu 31 July 2025 |
185.24 (4.95%) |
176.69 |
173.75 - 185.78 |
0.9961 times |
Mon 30 June 2025 |
176.51 (-0.25%) |
176.40 |
172.67 - 179.42 |
1.1173 times |
Fri 30 May 2025 |
176.96 (3.49%) |
171.88 |
168.84 - 179.36 |
0.9215 times |
Wed 30 April 2025 |
170.99 (0.11%) |
170.65 |
154.00 - 173.50 |
1.4847 times |
Mon 31 March 2025 |
170.81 (-0.38%) |
171.20 |
163.93 - 172.57 |
0.8064 times |
Fri 28 February 2025 |
171.47 (2.03%) |
165.73 |
165.60 - 174.04 |
0.6537 times |
Fri 31 January 2025 |
168.06 (2.84%) |
164.77 |
159.59 - 173.49 |
1.4466 times |
Tue 31 December 2024 |
163.42 (-8.66%) |
176.27 |
160.40 - 176.87 |
1.1093 times |

DMA SMA EMA moving averages of Utilities Etf VPU
DMA (daily moving average) of Utilities Etf VPU
| DMA period | DMA value | | 5 day DMA | 197.05 | | 12 day DMA | 197.11 | | 20 day DMA | 193.71 | | 35 day DMA | 189.11 | | 50 day DMA | 187.87 | | 100 day DMA | 183.29 | | 150 day DMA | 178.95 | | 200 day DMA | 176.43 | EMA (exponential moving average) of Utilities Etf VPU
| EMA period | EMA current | EMA prev | EMA prev2 | | 5 day EMA | 196.65 | 197.13 | 197.84 | | 12 day EMA | 195.92 | 195.96 | 196 | | 20 day EMA | 194.05 | 193.88 | 193.69 | | 35 day EMA | 191.53 | 191.29 | 191.03 | | 50 day EMA | 188.64 | 188.35 | 188.05 |
SMA (simple moving average) of Utilities Etf VPU
| SMA period | SMA current | SMA prev | SMA prev2 | | 5 day SMA | 197.05 | 197.77 | 198.92 | | 12 day SMA | 197.11 | 196.71 | 196.3 | | 20 day SMA | 193.71 | 193.25 | 192.71 | | 35 day SMA | 189.11 | 188.74 | 188.37 | | 50 day SMA | 187.87 | 187.68 | 187.49 | | 100 day SMA | 183.29 | 183.1 | 182.89 | | 150 day SMA | 178.95 | 178.79 | 178.63 | | 200 day SMA | 176.43 | 176.28 | 176.13 |
|
|
