MidcapGrowth VOT full analysis,charts,indicators,moving averages,SMA,DMA,EMA,ADX,MACD,RSIMidcap Growth VOT WideScreen charts, DMA,SMA,EMA technical analysis, forecast prediction, by indicators ADX,MACD,RSI,CCI AMEX stock exchange
Daily price and charts and targets MidcapGrowth Strong Daily Stock price targets for MidcapGrowth VOT are 291.38 and 295.41 | Daily Target 1 | 288.09 | | Daily Target 2 | 290.63 | | Daily Target 3 | 292.12333333333 | | Daily Target 4 | 294.66 | | Daily Target 5 | 296.15 |
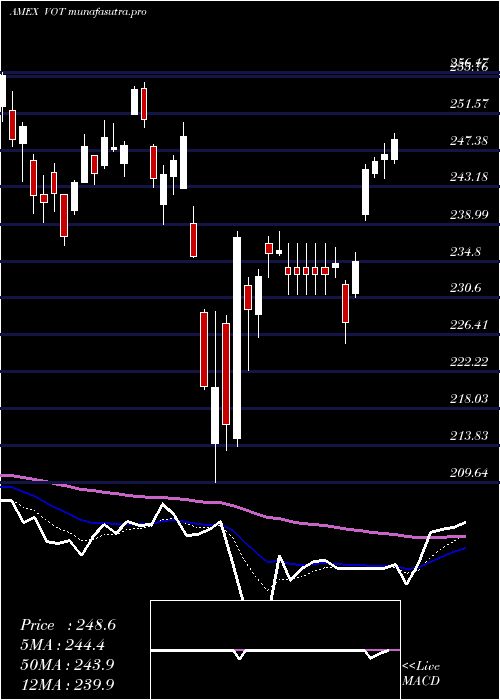
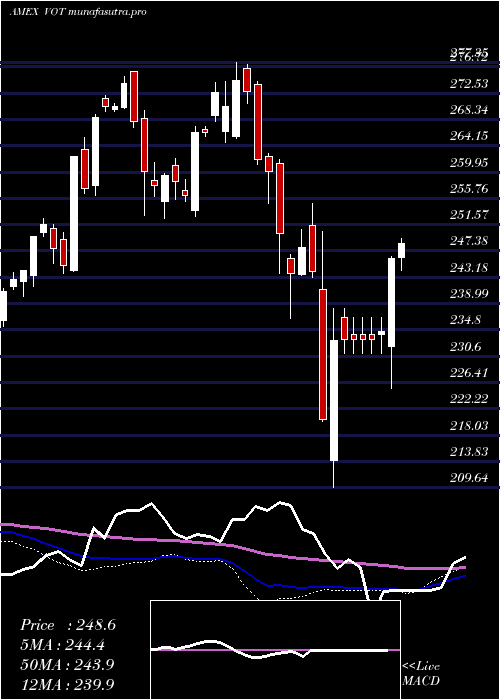
Daily price and volume Midcap Growth
| Date |
Closing |
Open |
Range |
Volume |
Thu 23 October 2025 |
293.16 (1.2%) |
289.59 |
289.59 - 293.62 |
0.6034 times |
Wed 22 October 2025 |
289.67 (-1.3%) |
293.63 |
287.85 - 293.63 |
1.0478 times |
Tue 21 October 2025 |
293.50 (0.32%) |
292.50 |
291.15 - 294.13 |
1.0519 times |
Mon 20 October 2025 |
292.57 (1.23%) |
291.70 |
291.07 - 293.15 |
0.5902 times |
Fri 17 October 2025 |
289.01 (-0.04%) |
288.15 |
286.94 - 290.14 |
1.0439 times |
Thu 16 October 2025 |
289.14 (-1.15%) |
293.72 |
288.78 - 294.69 |
1.0286 times |
Wed 15 October 2025 |
292.51 (-0%) |
294.74 |
290.84 - 296.32 |
1.0313 times |
Tue 14 October 2025 |
292.52 (0.41%) |
288.44 |
287.50 - 294.54 |
1.0017 times |
Mon 13 October 2025 |
291.32 (-0.95%) |
290.50 |
289.91 - 292.40 |
1.12 times |
Tue 07 October 2025 |
294.10 (-0.94%) |
297.00 |
292.10 - 297.32 |
1.4811 times |
Mon 06 October 2025 |
296.88 (0.31%) |
297.49 |
295.25 - 298.30 |
0.8723 times |
Weekly price and charts MidcapGrowth Strong weekly Stock price targets for MidcapGrowth VOT are 290.51 and 296.79 | Weekly Target 1 | 285.43 | | Weekly Target 2 | 289.3 | | Weekly Target 3 | 291.71333333333 | | Weekly Target 4 | 295.58 | | Weekly Target 5 | 297.99 |
Weekly price and volumes for Midcap Growth
| Date |
Closing |
Open |
Range |
Volume |
Thu 23 October 2025 |
293.16 (1.44%) |
291.70 |
287.85 - 294.13 |
0.5382 times |
Fri 17 October 2025 |
289.01 (-1.73%) |
290.50 |
286.94 - 296.32 |
0.854 times |
Tue 07 October 2025 |
294.10 (-0.63%) |
297.49 |
292.10 - 298.30 |
0.3846 times |
Fri 03 October 2025 |
295.95 (1.59%) |
292.97 |
291.24 - 297.95 |
1.1083 times |
Fri 26 September 2025 |
291.31 (-0.54%) |
291.67 |
286.24 - 294.55 |
1.0288 times |
Fri 19 September 2025 |
292.89 (0.49%) |
292.30 |
287.67 - 293.93 |
1.1301 times |
Fri 12 September 2025 |
291.46 (1.35%) |
288.77 |
287.93 - 294.59 |
1.0133 times |
Fri 05 September 2025 |
287.58 (-0.54%) |
285.14 |
284.00 - 290.29 |
2.7285 times |
Fri 29 August 2025 |
289.14 (0%) |
291.03 |
288.08 - 291.12 |
0.2132 times |
Fri 29 August 2025 |
289.14 (0.36%) |
288.09 |
286.26 - 291.65 |
1.0011 times |
Fri 22 August 2025 |
288.10 (1.13%) |
285.08 |
281.68 - 289.71 |
0.8925 times |
Monthly price and charts MidcapGrowth Strong monthly Stock price targets for MidcapGrowth VOT are 290.05 and 301.41 | Monthly Target 1 | 281.44 | | Monthly Target 2 | 287.3 | | Monthly Target 3 | 292.8 | | Monthly Target 4 | 298.66 | | Monthly Target 5 | 304.16 |
Monthly price and volumes Midcap Growth
| Date |
Closing |
Open |
Range |
Volume |
Thu 23 October 2025 |
293.16 (-0.21%) |
292.68 |
286.94 - 298.30 |
0.3589 times |
Tue 30 September 2025 |
293.79 (1.61%) |
285.14 |
284.00 - 294.59 |
1.0187 times |
Fri 29 August 2025 |
289.14 (-0.7%) |
286.88 |
281.68 - 291.65 |
0.7767 times |
Thu 31 July 2025 |
291.18 (2.39%) |
283.54 |
280.42 - 295.50 |
1.0244 times |
Mon 30 June 2025 |
284.39 (6.01%) |
267.91 |
265.04 - 284.61 |
0.8251 times |
Fri 30 May 2025 |
268.26 (7.78%) |
250.87 |
249.55 - 272.33 |
1.0396 times |
Wed 30 April 2025 |
248.90 (1.74%) |
244.32 |
209.64 - 250.47 |
1.5516 times |
Mon 31 March 2025 |
244.64 (-5.92%) |
261.36 |
236.56 - 262.01 |
1.2231 times |
Fri 28 February 2025 |
260.03 (-3.86%) |
265.62 |
255.01 - 277.35 |
1.1518 times |
Fri 31 January 2025 |
270.46 (6.59%) |
256.11 |
252.81 - 274.40 |
1.0302 times |
Tue 31 December 2024 |
253.75 (-6.16%) |
270.28 |
252.47 - 275.91 |
0.669 times |

DMA SMA EMA moving averages of Midcap Growth VOT
DMA (daily moving average) of Midcap Growth VOT
| DMA period | DMA value | | 5 day DMA | 291.58 | | 12 day DMA | 292.53 | | 20 day DMA | 292.5 | | 35 day DMA | 291.72 | | 50 day DMA | 290.32 | | 100 day DMA | 285.85 | | 150 day DMA | 273 | | 200 day DMA | 270.38 | EMA (exponential moving average) of Midcap Growth VOT
| EMA period | EMA current | EMA prev | EMA prev2 | | 5 day EMA | 291.92 | 291.3 | 292.11 | | 12 day EMA | 292.1 | 291.91 | 292.32 | | 20 day EMA | 292.04 | 291.92 | 292.16 | | 35 day EMA | 291.19 | 291.07 | 291.15 | | 50 day EMA | 290.16 | 290.04 | 290.06 |
SMA (simple moving average) of Midcap Growth VOT
| SMA period | SMA current | SMA prev | SMA prev2 | | 5 day SMA | 291.58 | 290.78 | 291.35 | | 12 day SMA | 292.53 | 292.77 | 293.12 | | 20 day SMA | 292.5 | 292.55 | 292.71 | | 35 day SMA | 291.72 | 291.61 | 291.59 | | 50 day SMA | 290.32 | 290.14 | 290.04 | | 100 day SMA | 285.85 | 285.61 | 285.36 | | 150 day SMA | 273 | 272.7 | 272.39 | | 200 day SMA | 270.38 | 270.21 | 270.04 |
|
|
