MidcapEtf VO full analysis,charts,indicators,moving averages,SMA,DMA,EMA,ADX,MACD,RSIMidcap Etf VO WideScreen charts, DMA,SMA,EMA technical analysis, forecast prediction, by indicators ADX,MACD,RSI,CCI AMEX stock exchange
Daily price and charts and targets MidcapEtf Strong Daily Stock price targets for MidcapEtf VO are 292.57 and 295.3 | Daily Target 1 | 290.39 | | Daily Target 2 | 292.02 | | Daily Target 3 | 293.12333333333 | | Daily Target 4 | 294.75 | | Daily Target 5 | 295.85 |
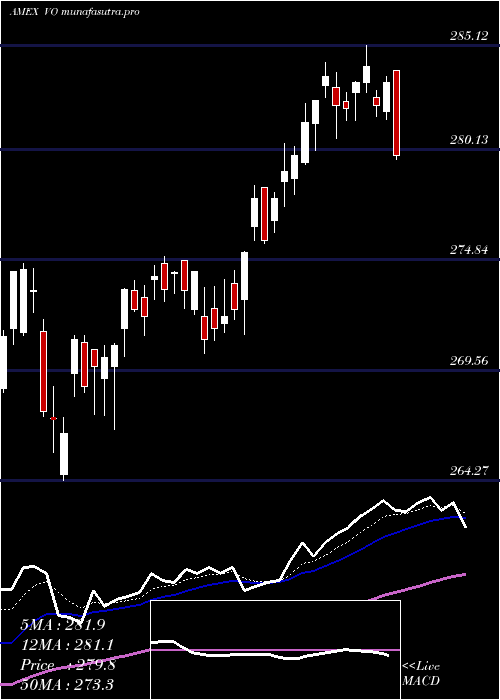
Daily price and volume Midcap Etf
| Date |
Closing |
Open |
Range |
Volume |
Thu 23 October 2025 |
293.64 (0.77%) |
292.14 |
291.50 - 294.23 |
0.5666 times |
Wed 22 October 2025 |
291.40 (-0.72%) |
293.74 |
290.04 - 293.79 |
2.6348 times |
Tue 21 October 2025 |
293.52 (0.46%) |
292.46 |
291.55 - 294.15 |
0.7653 times |
Mon 20 October 2025 |
292.17 (1.04%) |
290.00 |
290.00 - 292.68 |
0.59 times |
Fri 17 October 2025 |
289.16 (0.15%) |
286.48 |
286.32 - 289.83 |
0.713 times |
Thu 16 October 2025 |
288.73 (-1.27%) |
292.69 |
287.84 - 293.04 |
0.8858 times |
Wed 15 October 2025 |
292.44 (0.19%) |
293.66 |
290.17 - 295.11 |
0.8661 times |
Tue 14 October 2025 |
291.88 (0.79%) |
287.12 |
287.01 - 293.19 |
0.8422 times |
Mon 13 October 2025 |
289.59 (1.16%) |
289.12 |
288.23 - 290.42 |
0.8429 times |
Fri 10 October 2025 |
286.27 (-2.32%) |
293.73 |
286.21 - 294.41 |
1.2934 times |
Thu 09 October 2025 |
293.08 (-0.78%) |
295.60 |
292.47 - 295.70 |
0.7793 times |
Weekly price and charts MidcapEtf Strong weekly Stock price targets for MidcapEtf VO are 291.82 and 296.05 | Weekly Target 1 | 288.39 | | Weekly Target 2 | 291.02 | | Weekly Target 3 | 292.62333333333 | | Weekly Target 4 | 295.25 | | Weekly Target 5 | 296.85 |
Weekly price and volumes for Midcap Etf
| Date |
Closing |
Open |
Range |
Volume |
Thu 23 October 2025 |
293.64 (1.55%) |
290.00 |
290.00 - 294.23 |
1.0487 times |
Fri 17 October 2025 |
289.16 (1.01%) |
289.12 |
286.32 - 295.11 |
0.955 times |
Fri 10 October 2025 |
286.27 (-3.03%) |
296.67 |
286.21 - 297.00 |
1.0384 times |
Fri 03 October 2025 |
295.21 (0.95%) |
293.30 |
291.32 - 296.87 |
1.4705 times |
Fri 26 September 2025 |
292.42 (0.32%) |
290.87 |
288.14 - 293.94 |
0.9408 times |
Fri 19 September 2025 |
291.48 (-0.11%) |
292.37 |
288.19 - 293.20 |
1.4205 times |
Fri 12 September 2025 |
291.80 (0.83%) |
290.01 |
288.00 - 294.07 |
0.9688 times |
Fri 05 September 2025 |
289.41 (-0.18%) |
287.09 |
286.18 - 291.84 |
0.9224 times |
Fri 29 August 2025 |
289.93 (0%) |
290.73 |
289.19 - 291.45 |
0.2339 times |
Fri 29 August 2025 |
289.93 (-0.27%) |
290.00 |
288.15 - 291.45 |
1.0011 times |
Fri 22 August 2025 |
290.71 (1.72%) |
285.70 |
284.59 - 291.61 |
1.8367 times |
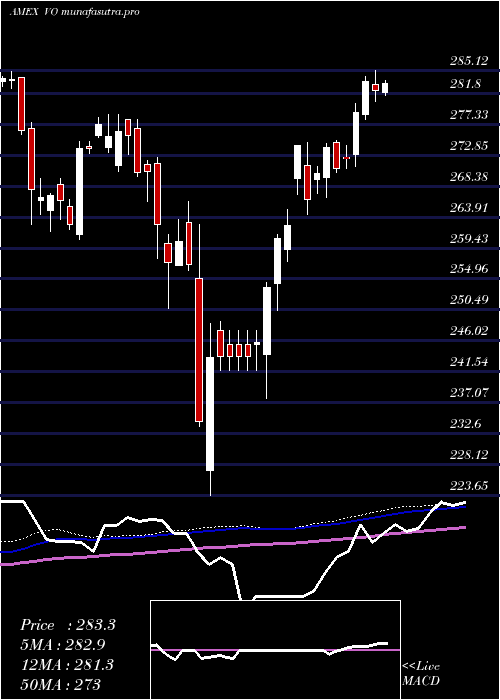
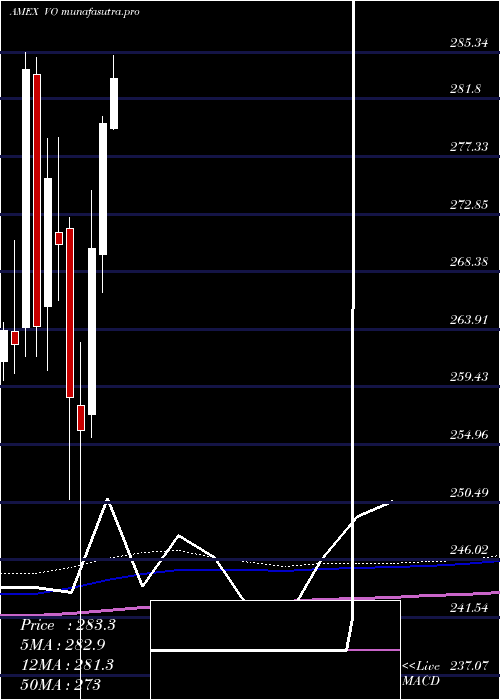
Monthly price and charts MidcapEtf Strong monthly Stock price targets for MidcapEtf VO are 289.93 and 300.72 | Monthly Target 1 | 281.49 | | Monthly Target 2 | 287.57 | | Monthly Target 3 | 292.28333333333 | | Monthly Target 4 | 298.36 | | Monthly Target 5 | 303.07 |
Monthly price and volumes Midcap Etf
| Date |
Closing |
Open |
Range |
Volume |
Thu 23 October 2025 |
293.64 (-0.03%) |
292.95 |
286.21 - 297.00 |
0.6123 times |
Tue 30 September 2025 |
293.74 (1.31%) |
287.09 |
286.18 - 294.07 |
0.7947 times |
Fri 29 August 2025 |
289.93 (1.38%) |
283.05 |
279.00 - 291.61 |
0.9113 times |
Thu 31 July 2025 |
285.99 (2.2%) |
279.49 |
277.44 - 289.98 |
1.013 times |
Mon 30 June 2025 |
279.83 (3.58%) |
269.72 |
266.76 - 280.41 |
0.7303 times |
Fri 30 May 2025 |
270.16 (5.49%) |
257.30 |
255.56 - 274.68 |
0.9083 times |
Wed 30 April 2025 |
256.09 (-0.98%) |
258.01 |
223.65 - 262.85 |
2.0019 times |
Mon 31 March 2025 |
258.62 (-4.4%) |
271.71 |
250.69 - 272.55 |
1.2332 times |
Fri 28 February 2025 |
270.51 (-1.85%) |
271.40 |
266.13 - 278.75 |
0.8559 times |
Fri 31 January 2025 |
275.61 (4.35%) |
265.65 |
260.70 - 278.73 |
0.9391 times |
Tue 31 December 2024 |
264.13 (-7.01%) |
283.71 |
261.82 - 284.98 |
0.7486 times |
DMA SMA EMA moving averages of Midcap Etf VO
DMA (daily moving average) of Midcap Etf VO
| DMA period | DMA value | | 5 day DMA | 291.98 | | 12 day DMA | 291.44 | | 20 day DMA | 292.45 | | 35 day DMA | 291.81 | | 50 day DMA | 290.77 | | 100 day DMA | 285.68 | | 150 day DMA | 275.95 | | 200 day DMA | 274.39 | EMA (exponential moving average) of Midcap Etf VO
| EMA period | EMA current | EMA prev | EMA prev2 | | 5 day EMA | 292.29 | 291.61 | 291.72 | | 12 day EMA | 291.93 | 291.62 | 291.66 | | 20 day EMA | 291.83 | 291.64 | 291.66 | | 35 day EMA | 291.18 | 291.04 | 291.02 | | 50 day EMA | 290.44 | 290.31 | 290.27 |
SMA (simple moving average) of Midcap Etf VO
| SMA period | SMA current | SMA prev | SMA prev2 | | 5 day SMA | 291.98 | 291 | 291.2 | | 12 day SMA | 291.44 | 291.44 | 291.78 | | 20 day SMA | 292.45 | 292.23 | 292.22 | | 35 day SMA | 291.81 | 291.69 | 291.59 | | 50 day SMA | 290.77 | 290.62 | 290.57 | | 100 day SMA | 285.68 | 285.45 | 285.23 | | 150 day SMA | 275.95 | 275.73 | 275.54 | | 200 day SMA | 274.39 | 274.25 | 274.12 |
|
|
