RexVolmaxx VMAX full analysis,charts,indicators,moving averages,SMA,DMA,EMA,ADX,MACD,RSIRex Volmaxx VMAX WideScreen charts, DMA,SMA,EMA technical analysis, forecast prediction, by indicators ADX,MACD,RSI,CCI AMEX stock exchange
Daily price and charts and targets RexVolmaxx Strong Daily Stock price targets for RexVolmaxx VMAX are 52.81 and 52.81 | Daily Target 1 | 52.75 | | Daily Target 2 | 52.75 | | Daily Target 3 | 52.86 | | Daily Target 4 | 52.86 | | Daily Target 5 | 52.863333333333 |
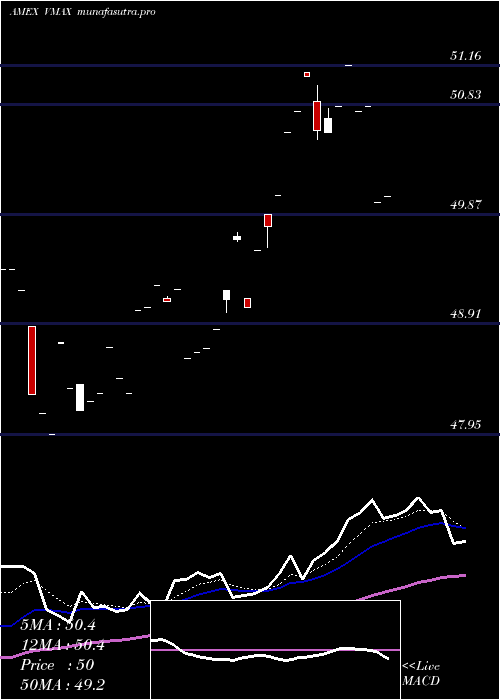
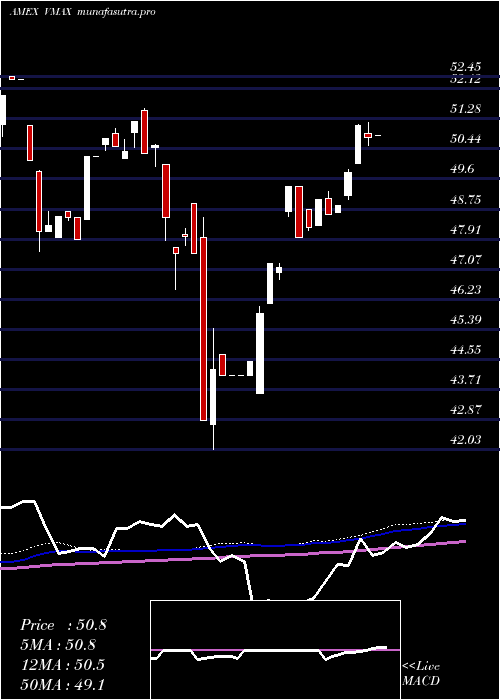
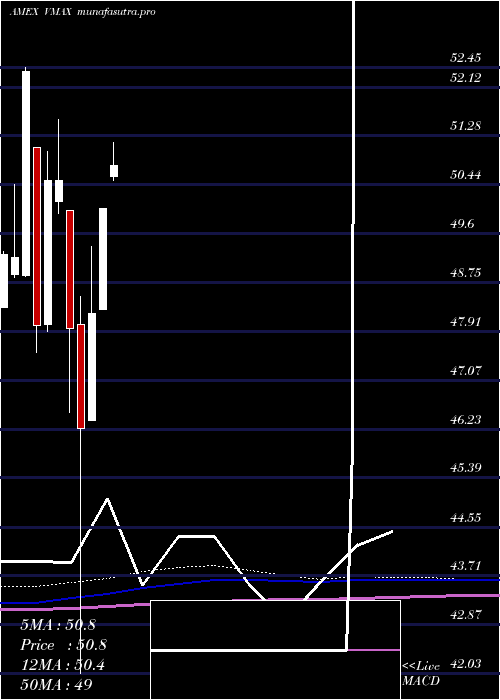
Daily price and volume Rex Volmaxx
| Date |
Closing |
Open |
Range |
Volume |
Thu 23 October 2025 |
52.63 (0%) |
52.98 |
52.98 - 52.98 |
0 times |
Wed 22 October 2025 |
52.63 (-0.66%) |
52.61 |
52.61 - 52.61 |
0 times |
Tue 21 October 2025 |
52.98 (0.67%) |
52.98 |
52.98 - 52.98 |
0.5882 times |
Mon 20 October 2025 |
52.63 (0%) |
53.06 |
53.06 - 53.06 |
0 times |
Fri 17 October 2025 |
52.63 (0.25%) |
52.63 |
52.63 - 52.63 |
0.5882 times |
Thu 16 October 2025 |
52.50 (-1.33%) |
52.50 |
52.50 - 52.50 |
0.5882 times |
Wed 15 October 2025 |
53.21 (0.51%) |
53.21 |
53.21 - 53.21 |
0.5882 times |
Tue 14 October 2025 |
52.94 (0.76%) |
53.17 |
52.94 - 53.17 |
0.5882 times |
Mon 13 October 2025 |
52.54 (-1.52%) |
52.54 |
52.54 - 52.54 |
0.5882 times |
Tue 07 October 2025 |
53.35 (-0.34%) |
53.39 |
53.35 - 53.39 |
6.4706 times |
Mon 06 October 2025 |
53.53 (-0.04%) |
53.53 |
53.53 - 53.53 |
0 times |
Weekly price and charts RexVolmaxx Strong weekly Stock price targets for RexVolmaxx VMAX are 52.4 and 52.85 | Weekly Target 1 | 52.32 | | Weekly Target 2 | 52.47 | | Weekly Target 3 | 52.766666666667 | | Weekly Target 4 | 52.92 | | Weekly Target 5 | 53.22 |
Weekly price and volumes for Rex Volmaxx
| Date |
Closing |
Open |
Range |
Volume |
Thu 23 October 2025 |
52.63 (0%) |
53.06 |
52.61 - 53.06 |
0.041 times |
Fri 17 October 2025 |
52.63 (-1.35%) |
52.54 |
52.50 - 53.21 |
0.2049 times |
Tue 07 October 2025 |
53.35 (-0.37%) |
53.53 |
53.35 - 53.53 |
0.4508 times |
Fri 03 October 2025 |
53.55 (0.66%) |
53.06 |
53.01 - 53.55 |
0.123 times |
Fri 26 September 2025 |
53.20 (-0.41%) |
53.35 |
52.74 - 53.52 |
0.2459 times |
Fri 19 September 2025 |
53.42 (0.49%) |
53.21 |
53.08 - 53.55 |
0.5328 times |
Fri 12 September 2025 |
53.16 (0.7%) |
52.72 |
52.72 - 53.39 |
7.377 times |
Fri 05 September 2025 |
52.79 (0%) |
52.57 |
52.52 - 53.09 |
0.1639 times |
Fri 29 August 2025 |
52.79 (0%) |
52.79 |
52.79 - 52.79 |
0.041 times |
Fri 29 August 2025 |
52.79 (0.38%) |
52.49 |
52.49 - 52.85 |
0.8197 times |
Fri 22 August 2025 |
52.59 (2.22%) |
51.36 |
51.36 - 52.59 |
2.418 times |
Monthly price and charts RexVolmaxx Strong monthly Stock price targets for RexVolmaxx VMAX are 52.04 and 53.09 | Monthly Target 1 | 51.84 | | Monthly Target 2 | 52.24 | | Monthly Target 3 | 52.893333333333 | | Monthly Target 4 | 53.29 | | Monthly Target 5 | 53.94 |
Monthly price and volumes Rex Volmaxx
| Date |
Closing |
Open |
Range |
Volume |
Thu 23 October 2025 |
52.63 (-0.72%) |
53.18 |
52.50 - 53.55 |
0.0899 times |
Tue 30 September 2025 |
53.01 (0.42%) |
52.57 |
52.52 - 53.55 |
1.0239 times |
Fri 29 August 2025 |
52.79 (4.6%) |
49.75 |
49.75 - 52.85 |
0.4495 times |
Thu 31 July 2025 |
50.47 (0.88%) |
50.58 |
49.97 - 51.31 |
0.6137 times |
Mon 30 June 2025 |
50.03 (3.73%) |
48.30 |
48.30 - 50.03 |
1.1223 times |
Fri 30 May 2025 |
48.23 (4.28%) |
46.38 |
46.38 - 49.38 |
5.8293 times |
Wed 30 April 2025 |
46.25 (-3.59%) |
48.04 |
42.03 - 48.52 |
0.3399 times |
Mon 31 March 2025 |
47.97 (-5.05%) |
50.00 |
46.52 - 50.00 |
0.1067 times |
Fri 28 February 2025 |
50.52 (0.02%) |
50.15 |
49.94 - 51.56 |
0.3097 times |
Fri 31 January 2025 |
50.51 (5.19%) |
48.04 |
47.91 - 51.00 |
0.1151 times |
Tue 31 December 2024 |
48.02 (-8.32%) |
51.07 |
47.56 - 51.07 |
0.087 times |
DMA SMA EMA moving averages of Rex Volmaxx VMAX
DMA (daily moving average) of Rex Volmaxx VMAX
| DMA period | DMA value | | 5 day DMA | 52.7 | | 12 day DMA | 52.93 | | 20 day DMA | 53.01 | | 35 day DMA | 53.03 | | 50 day DMA | 52.75 | | 100 day DMA | 51.32 | | 150 day DMA | 49.75 | | 200 day DMA | 49.74 | EMA (exponential moving average) of Rex Volmaxx VMAX
| EMA period | EMA current | EMA prev | EMA prev2 | | 5 day EMA | 52.72 | 52.76 | 52.83 | | 12 day EMA | 52.85 | 52.89 | 52.94 | | 20 day EMA | 52.89 | 52.92 | 52.95 | | 35 day EMA | 52.72 | 52.73 | 52.74 | | 50 day EMA | 52.55 | 52.55 | 52.55 |
SMA (simple moving average) of Rex Volmaxx VMAX
| SMA period | SMA current | SMA prev | SMA prev2 | | 5 day SMA | 52.7 | 52.67 | 52.79 | | 12 day SMA | 52.93 | 52.98 | 53.02 | | 20 day SMA | 53.01 | 53.06 | 53.1 | | 35 day SMA | 53.03 | 53.04 | 53.04 | | 50 day SMA | 52.75 | 52.71 | 52.67 | | 100 day SMA | 51.32 | 51.28 | 51.23 | | 150 day SMA | 49.75 | 49.71 | 49.67 | | 200 day SMA | 49.74 | 49.72 | 49.69 |
|
|
