InvescoAdvantage VKI full analysis,charts,indicators,moving averages,SMA,DMA,EMA,ADX,MACD,RSIInvesco Advantage VKI WideScreen charts, DMA,SMA,EMA technical analysis, forecast prediction, by indicators ADX,MACD,RSI,CCI AMEX stock exchange
Daily price and charts and targets InvescoAdvantage Strong Daily Stock price targets for InvescoAdvantage VKI are 8.85 and 8.92 | Daily Target 1 | 8.79 | | Daily Target 2 | 8.83 | | Daily Target 3 | 8.8566666666667 | | Daily Target 4 | 8.9 | | Daily Target 5 | 8.93 |
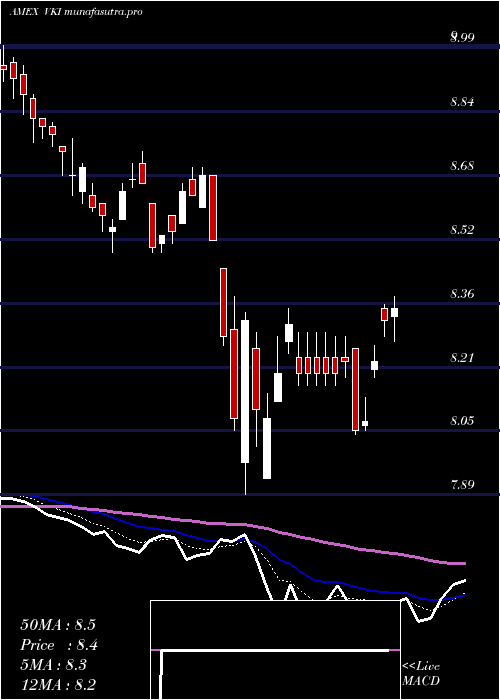
Daily price and volume Invesco Advantage
| Date |
Closing |
Open |
Range |
Volume |
Thu 23 October 2025 |
8.88 (-0.11%) |
8.85 |
8.81 - 8.88 |
0.6088 times |
Wed 22 October 2025 |
8.89 (-0.34%) |
8.91 |
8.81 - 8.91 |
0.8862 times |
Tue 21 October 2025 |
8.92 (0.9%) |
8.88 |
8.86 - 8.92 |
1.2528 times |
Mon 20 October 2025 |
8.84 (0.45%) |
8.81 |
8.77 - 8.86 |
0.7296 times |
Fri 17 October 2025 |
8.80 (-0.45%) |
8.86 |
8.72 - 8.86 |
1.4892 times |
Thu 16 October 2025 |
8.84 (-0.79%) |
8.90 |
8.80 - 8.90 |
0.8577 times |
Wed 15 October 2025 |
8.91 (0.11%) |
8.90 |
8.84 - 8.95 |
0.9904 times |
Tue 14 October 2025 |
8.90 (0.23%) |
8.88 |
8.84 - 8.91 |
1.3647 times |
Mon 13 October 2025 |
8.88 (2.07%) |
8.83 |
8.80 - 8.88 |
0.6723 times |
Tue 07 October 2025 |
8.70 (-0.11%) |
8.75 |
8.67 - 8.82 |
1.1483 times |
Mon 06 October 2025 |
8.71 (-1.02%) |
8.80 |
8.66 - 8.81 |
1.025 times |
Weekly price and charts InvescoAdvantage Strong weekly Stock price targets for InvescoAdvantage VKI are 8.83 and 8.98 | Weekly Target 1 | 8.71 | | Weekly Target 2 | 8.79 | | Weekly Target 3 | 8.8566666666667 | | Weekly Target 4 | 8.94 | | Weekly Target 5 | 9.01 |
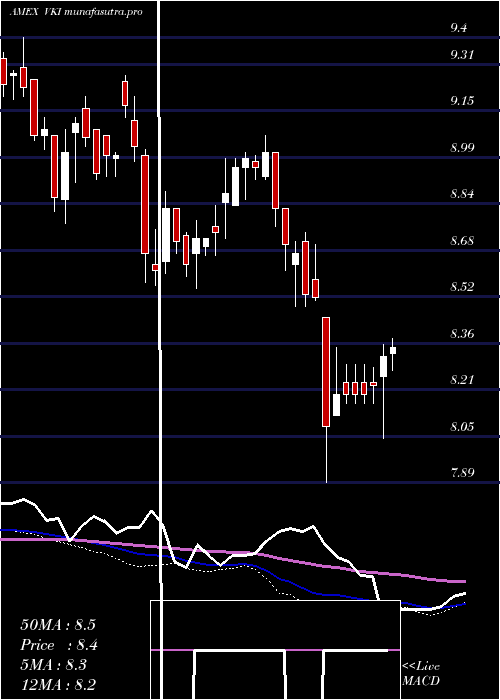
Weekly price and volumes for Invesco Advantage
| Date |
Closing |
Open |
Range |
Volume |
Thu 23 October 2025 |
8.88 (0.91%) |
8.81 |
8.77 - 8.92 |
0.6853 times |
Fri 17 October 2025 |
8.80 (1.15%) |
8.83 |
8.72 - 8.95 |
1.0591 times |
Tue 07 October 2025 |
8.70 (-1.14%) |
8.80 |
8.66 - 8.82 |
0.4283 times |
Fri 03 October 2025 |
8.80 (0.92%) |
8.76 |
8.71 - 8.88 |
1.0178 times |
Fri 26 September 2025 |
8.72 (-0.68%) |
8.73 |
8.64 - 8.78 |
0.8534 times |
Fri 19 September 2025 |
8.78 (0.69%) |
8.75 |
8.62 - 8.82 |
0.8568 times |
Fri 12 September 2025 |
8.72 (3.93%) |
8.41 |
8.40 - 8.74 |
1.5205 times |
Fri 05 September 2025 |
8.39 (1.21%) |
8.27 |
8.25 - 8.42 |
1.2674 times |
Fri 29 August 2025 |
8.29 (0%) |
8.29 |
8.28 - 8.34 |
0.2856 times |
Fri 29 August 2025 |
8.29 (-0.12%) |
8.35 |
8.26 - 8.35 |
2.0258 times |
Fri 22 August 2025 |
8.30 (-1.07%) |
8.35 |
8.25 - 8.36 |
1.1748 times |
Monthly price and charts InvescoAdvantage Strong monthly Stock price targets for InvescoAdvantage VKI are 8.74 and 9.03 | Monthly Target 1 | 8.54 | | Monthly Target 2 | 8.71 | | Monthly Target 3 | 8.83 | | Monthly Target 4 | 9 | | Monthly Target 5 | 9.12 |
Monthly price and volumes Invesco Advantage
| Date |
Closing |
Open |
Range |
Volume |
Thu 23 October 2025 |
8.88 (1.25%) |
8.88 |
8.66 - 8.95 |
0.6511 times |
Tue 30 September 2025 |
8.77 (5.79%) |
8.27 |
8.25 - 8.82 |
1.2022 times |
Fri 29 August 2025 |
8.29 (0.97%) |
8.21 |
8.20 - 8.45 |
1.249 times |
Thu 31 July 2025 |
8.21 (-1.91%) |
8.37 |
8.14 - 8.51 |
0.9913 times |
Mon 30 June 2025 |
8.37 (0.84%) |
8.30 |
8.10 - 8.38 |
0.9622 times |
Fri 30 May 2025 |
8.30 (-2.24%) |
8.51 |
8.12 - 8.57 |
0.956 times |
Wed 30 April 2025 |
8.49 (-0.59%) |
8.56 |
7.89 - 8.70 |
1.2249 times |
Mon 31 March 2025 |
8.54 (-5.22%) |
9.01 |
8.49 - 9.01 |
0.8275 times |
Fri 28 February 2025 |
9.01 (1.58%) |
8.83 |
8.83 - 9.07 |
0.7856 times |
Fri 31 January 2025 |
8.87 (1.49%) |
8.80 |
8.55 - 8.99 |
1.1501 times |
Tue 31 December 2024 |
8.74 (-2.89%) |
9.25 |
8.56 - 9.27 |
1.1588 times |

DMA SMA EMA moving averages of Invesco Advantage VKI
DMA (daily moving average) of Invesco Advantage VKI
| DMA period | DMA value | | 5 day DMA | 8.87 | | 12 day DMA | 8.84 | | 20 day DMA | 8.81 | | 35 day DMA | 8.72 | | 50 day DMA | 8.6 | | 100 day DMA | 8.43 | | 150 day DMA | 8.41 | | 200 day DMA | 8.52 | EMA (exponential moving average) of Invesco Advantage VKI
| EMA period | EMA current | EMA prev | EMA prev2 | | 5 day EMA | 8.87 | 8.87 | 8.86 | | 12 day EMA | 8.85 | 8.84 | 8.83 | | 20 day EMA | 8.82 | 8.81 | 8.8 | | 35 day EMA | 8.71 | 8.7 | 8.69 | | 50 day EMA | 8.6 | 8.59 | 8.58 |
SMA (simple moving average) of Invesco Advantage VKI
| SMA period | SMA current | SMA prev | SMA prev2 | | 5 day SMA | 8.87 | 8.86 | 8.86 | | 12 day SMA | 8.84 | 8.84 | 8.83 | | 20 day SMA | 8.81 | 8.8 | 8.79 | | 35 day SMA | 8.72 | 8.71 | 8.69 | | 50 day SMA | 8.6 | 8.59 | 8.58 | | 100 day SMA | 8.43 | 8.42 | 8.41 | | 150 day SMA | 8.41 | 8.41 | 8.41 | | 200 day SMA | 8.52 | 8.52 | 8.52 |
|
|
