IndustrialsEtf VIS full analysis,charts,indicators,moving averages,SMA,DMA,EMA,ADX,MACD,RSIIndustrials Etf VIS WideScreen charts, DMA,SMA,EMA technical analysis, forecast prediction, by indicators ADX,MACD,RSI,CCI AMEX stock exchange
Daily price and charts and targets IndustrialsEtf Strong Daily Stock price targets for IndustrialsEtf VIS are 297.46 and 301.27 | Daily Target 1 | 294.34 | | Daily Target 2 | 296.77 | | Daily Target 3 | 298.15 | | Daily Target 4 | 300.58 | | Daily Target 5 | 301.96 |
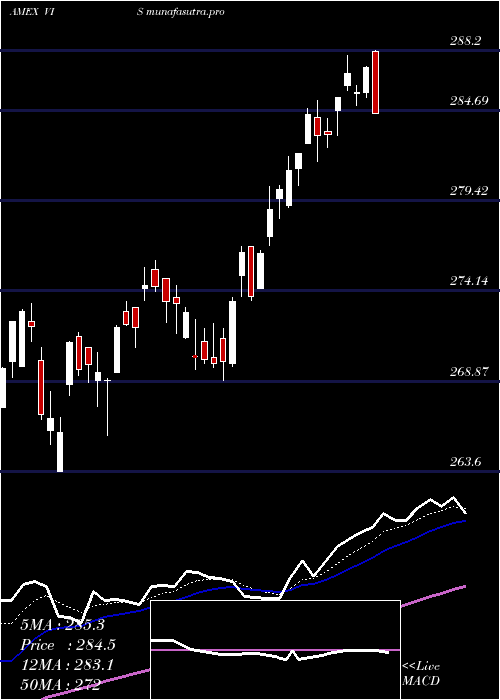
Daily price and volume Industrials Etf
| Date |
Closing |
Open |
Range |
Volume |
Thu 23 October 2025 |
299.20 (1.55%) |
295.72 |
295.72 - 299.53 |
0.8052 times |
Wed 22 October 2025 |
294.62 (-1.55%) |
299.67 |
293.80 - 300.00 |
0.9566 times |
Tue 21 October 2025 |
299.25 (0.75%) |
297.30 |
297.30 - 300.52 |
1.0851 times |
Mon 20 October 2025 |
297.01 (1.34%) |
295.20 |
295.14 - 297.50 |
0.504 times |
Fri 17 October 2025 |
293.07 (-0.15%) |
292.66 |
291.58 - 294.62 |
0.7239 times |
Thu 16 October 2025 |
293.52 (-0.73%) |
296.90 |
292.27 - 296.90 |
0.4862 times |
Wed 15 October 2025 |
295.68 (-0.32%) |
298.19 |
294.07 - 299.47 |
1.3044 times |
Tue 14 October 2025 |
296.62 (1.23%) |
290.06 |
290.00 - 297.99 |
1.44 times |
Mon 13 October 2025 |
293.01 (1.35%) |
291.88 |
291.48 - 293.99 |
1.0896 times |
Fri 10 October 2025 |
289.12 (-2.3%) |
296.79 |
289.04 - 297.77 |
1.6051 times |
Thu 09 October 2025 |
295.93 (-1.43%) |
300.31 |
295.33 - 300.99 |
0.8816 times |
Weekly price and charts IndustrialsEtf Strong weekly Stock price targets for IndustrialsEtf VIS are 296.5 and 303.22 | Weekly Target 1 | 291.12 | | Weekly Target 2 | 295.16 | | Weekly Target 3 | 297.84 | | Weekly Target 4 | 301.88 | | Weekly Target 5 | 304.56 |
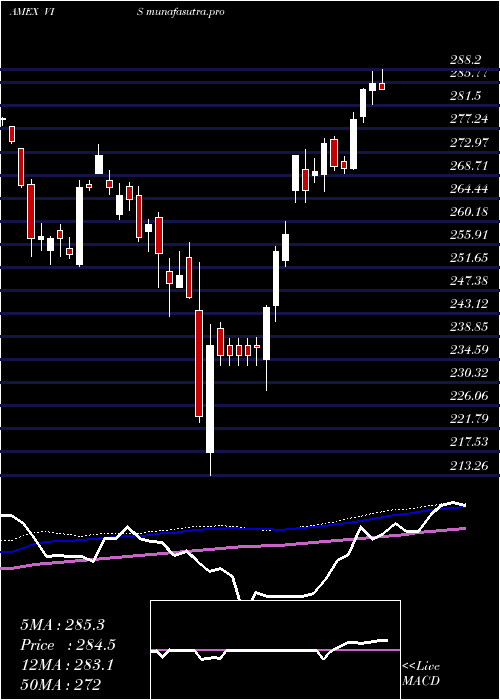
Weekly price and volumes for Industrials Etf
| Date |
Closing |
Open |
Range |
Volume |
Thu 23 October 2025 |
299.20 (2.09%) |
295.20 |
293.80 - 300.52 |
0.6574 times |
Fri 17 October 2025 |
293.07 (1.37%) |
291.88 |
290.00 - 299.47 |
0.9895 times |
Fri 10 October 2025 |
289.12 (-2.87%) |
296.68 |
289.04 - 300.99 |
0.9458 times |
Fri 03 October 2025 |
297.66 (1.65%) |
295.35 |
292.81 - 299.58 |
1.0872 times |
Fri 26 September 2025 |
292.83 (-0.48%) |
293.79 |
288.87 - 297.92 |
1.3078 times |
Fri 19 September 2025 |
294.25 (1.14%) |
291.62 |
288.48 - 294.97 |
1.2941 times |
Fri 12 September 2025 |
290.92 (0.26%) |
290.47 |
286.37 - 294.20 |
1.4586 times |
Fri 05 September 2025 |
290.16 (-0.39%) |
288.39 |
286.10 - 292.06 |
1.0874 times |
Fri 29 August 2025 |
291.31 (0%) |
293.91 |
290.50 - 293.91 |
0.2107 times |
Fri 29 August 2025 |
291.31 (-0.78%) |
293.28 |
290.50 - 294.88 |
0.9615 times |
Fri 22 August 2025 |
293.60 (1.91%) |
287.93 |
287.13 - 295.37 |
1.7309 times |
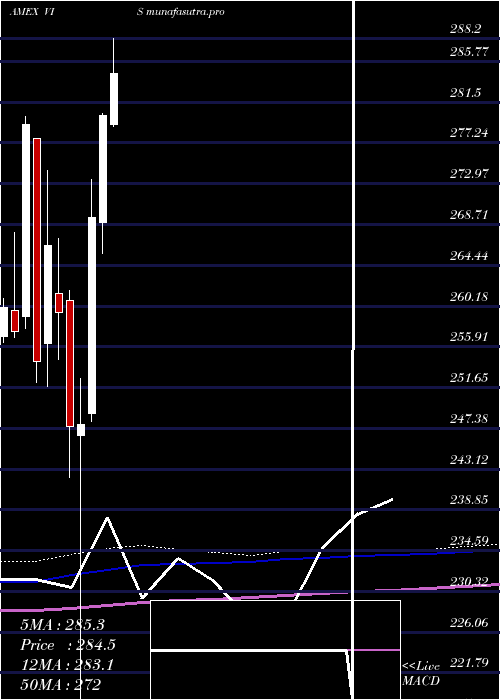
Monthly price and charts IndustrialsEtf Strong monthly Stock price targets for IndustrialsEtf VIS are 294.12 and 306.07 | Monthly Target 1 | 284.46 | | Monthly Target 2 | 291.83 | | Monthly Target 3 | 296.41 | | Monthly Target 4 | 303.78 | | Monthly Target 5 | 308.36 |
Monthly price and volumes Industrials Etf
| Date |
Closing |
Open |
Range |
Volume |
Thu 23 October 2025 |
299.20 (0.98%) |
294.55 |
289.04 - 300.99 |
0.4042 times |
Tue 30 September 2025 |
296.29 (1.71%) |
288.39 |
286.10 - 297.92 |
0.7331 times |
Fri 29 August 2025 |
291.31 (0.46%) |
286.32 |
282.26 - 295.37 |
0.819 times |
Thu 31 July 2025 |
289.98 (3.54%) |
279.13 |
279.00 - 295.78 |
0.7869 times |
Mon 30 June 2025 |
280.07 (3.96%) |
268.92 |
265.70 - 280.31 |
0.8659 times |
Fri 30 May 2025 |
269.39 (8.7%) |
248.94 |
248.06 - 273.44 |
0.8077 times |
Wed 30 April 2025 |
247.83 (0.11%) |
246.65 |
213.26 - 252.56 |
1.9654 times |
Mon 31 March 2025 |
247.55 (-4.62%) |
260.80 |
242.26 - 261.76 |
1.1838 times |
Fri 28 February 2025 |
259.53 (-2.6%) |
261.53 |
254.54 - 267.28 |
1.0189 times |
Fri 31 January 2025 |
266.46 (4.74%) |
256.24 |
251.75 - 274.33 |
1.4151 times |
Tue 31 December 2024 |
254.39 (-8.86%) |
277.72 |
252.15 - 277.72 |
0.8619 times |
DMA SMA EMA moving averages of Industrials Etf VIS
DMA (daily moving average) of Industrials Etf VIS
| DMA period | DMA value | | 5 day DMA | 296.63 | | 12 day DMA | 295.6 | | 20 day DMA | 295.85 | | 35 day DMA | 294.17 | | 50 day DMA | 293.11 | | 100 day DMA | 287.75 | | 150 day DMA | 275.19 | | 200 day DMA | 271.44 | EMA (exponential moving average) of Industrials Etf VIS
| EMA period | EMA current | EMA prev | EMA prev2 | | 5 day EMA | 296.97 | 295.85 | 296.47 | | 12 day EMA | 296.08 | 295.51 | 295.67 | | 20 day EMA | 295.46 | 295.07 | 295.12 | | 35 day EMA | 294.38 | 294.1 | 294.07 | | 50 day EMA | 293.19 | 292.94 | 292.87 |
SMA (simple moving average) of Industrials Etf VIS
| SMA period | SMA current | SMA prev | SMA prev2 | | 5 day SMA | 296.63 | 295.49 | 295.71 | | 12 day SMA | 295.6 | 295.44 | 295.83 | | 20 day SMA | 295.85 | 295.41 | 295.29 | | 35 day SMA | 294.17 | 293.93 | 293.72 | | 50 day SMA | 293.11 | 292.92 | 292.88 | | 100 day SMA | 287.75 | 287.45 | 287.2 | | 150 day SMA | 275.19 | 274.87 | 274.6 | | 200 day SMA | 271.44 | 271.23 | 271.04 |
|
|
