SP VIOV full analysis,charts,indicators,moving averages,SMA,DMA,EMA,ADX,MACD,RSIS P VIOV WideScreen charts, DMA,SMA,EMA technical analysis, forecast prediction, by indicators ADX,MACD,RSI,CCI AMEX stock exchange
Daily price and charts and targets SP Strong Daily Stock price targets for SP VIOV are 95.99 and 97.34 | Daily Target 1 | 94.88 | | Daily Target 2 | 95.75 | | Daily Target 3 | 96.23 | | Daily Target 4 | 97.1 | | Daily Target 5 | 97.58 |
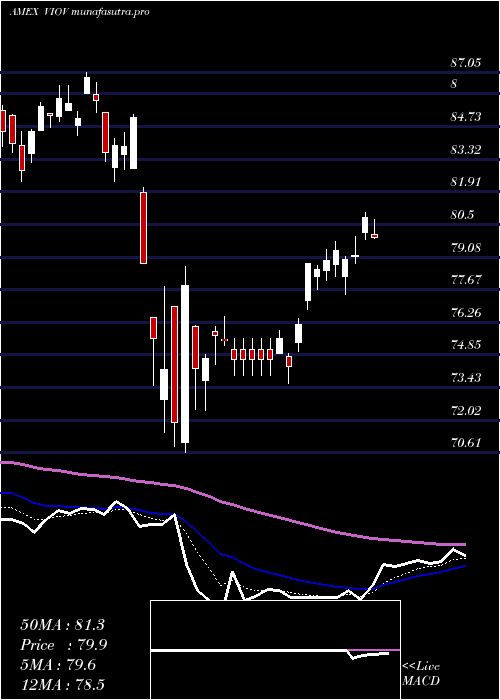
Daily price and volume S P
| Date |
Closing |
Open |
Range |
Volume |
Thu 23 October 2025 |
96.62 (1.31%) |
95.36 |
95.36 - 96.71 |
0.4312 times |
Wed 22 October 2025 |
95.37 (-0.46%) |
95.79 |
94.69 - 96.02 |
0.7131 times |
Tue 21 October 2025 |
95.81 (0.22%) |
95.32 |
95.14 - 96.22 |
1.1575 times |
Mon 20 October 2025 |
95.60 (1.68%) |
94.70 |
94.70 - 95.75 |
0.9016 times |
Fri 17 October 2025 |
94.02 (-0.22%) |
93.98 |
93.56 - 94.18 |
0.5423 times |
Thu 16 October 2025 |
94.23 (-1.22%) |
95.54 |
93.86 - 95.54 |
1.4171 times |
Wed 15 October 2025 |
95.39 (0.72%) |
95.36 |
94.92 - 96.23 |
1.48 times |
Tue 14 October 2025 |
94.71 (1.51%) |
91.94 |
91.94 - 95.15 |
1.0557 times |
Mon 13 October 2025 |
93.30 (2.29%) |
92.53 |
92.34 - 93.50 |
0.8418 times |
Fri 10 October 2025 |
91.21 (-3.52%) |
94.66 |
91.11 - 94.82 |
1.4596 times |
Thu 09 October 2025 |
94.54 (-1.11%) |
95.60 |
94.34 - 95.60 |
1.256 times |
Weekly price and charts SP Strong weekly Stock price targets for SP VIOV are 95.66 and 97.68 | Weekly Target 1 | 93.99 | | Weekly Target 2 | 95.3 | | Weekly Target 3 | 96.006666666667 | | Weekly Target 4 | 97.32 | | Weekly Target 5 | 98.03 |
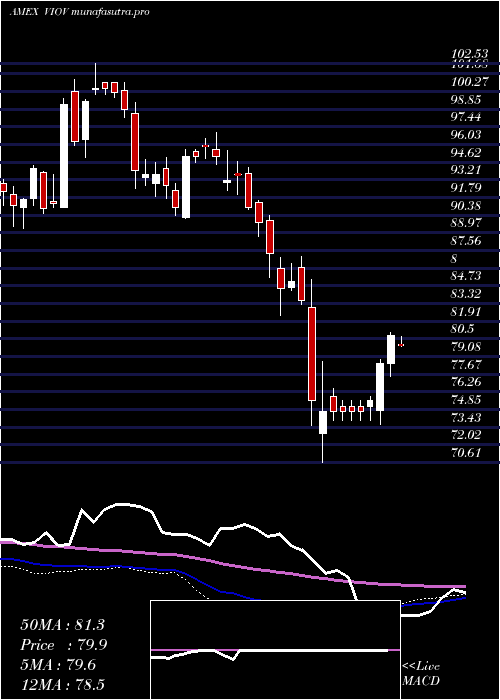
Weekly price and volumes for S P
| Date |
Closing |
Open |
Range |
Volume |
Thu 23 October 2025 |
96.62 (2.77%) |
94.70 |
94.69 - 96.71 |
0.3964 times |
Fri 17 October 2025 |
94.02 (3.08%) |
92.53 |
91.94 - 96.23 |
0.6604 times |
Fri 10 October 2025 |
91.21 (-5.79%) |
97.48 |
91.11 - 97.48 |
0.9489 times |
Fri 03 October 2025 |
96.82 (2.11%) |
95.53 |
94.14 - 97.72 |
0.8228 times |
Fri 26 September 2025 |
94.82 (-1.08%) |
95.86 |
93.45 - 97.28 |
0.9967 times |
Fri 19 September 2025 |
95.86 (0.75%) |
95.52 |
94.52 - 97.33 |
1.1043 times |
Fri 12 September 2025 |
95.15 (-0.71%) |
96.04 |
94.05 - 96.43 |
1.8973 times |
Fri 05 September 2025 |
95.83 (1.6%) |
93.26 |
92.85 - 96.58 |
1.019 times |
Fri 29 August 2025 |
94.32 (0%) |
94.78 |
94.15 - 95.33 |
0.8094 times |
Fri 29 August 2025 |
94.32 (-0.3%) |
94.13 |
93.77 - 95.33 |
1.3449 times |
Fri 22 August 2025 |
94.60 (3.81%) |
91.00 |
90.12 - 94.78 |
0.8976 times |
Monthly price and charts SP Strong monthly Stock price targets for SP VIOV are 93.87 and 100.48 | Monthly Target 1 | 88.54 | | Monthly Target 2 | 92.58 | | Monthly Target 3 | 95.15 | | Monthly Target 4 | 99.19 | | Monthly Target 5 | 101.76 |
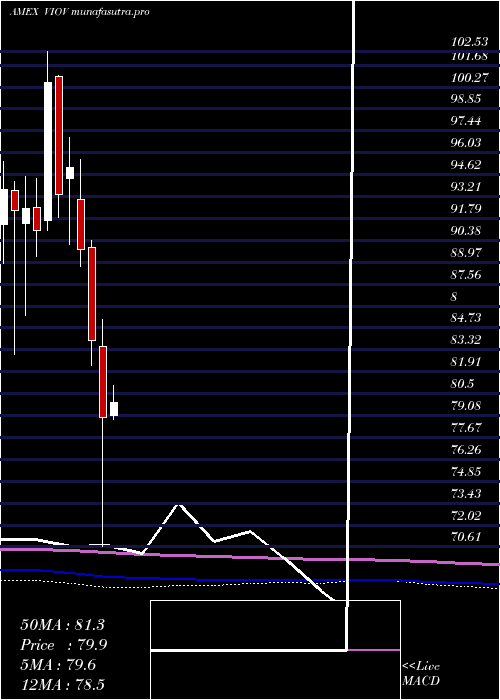
Monthly price and volumes S P
| Date |
Closing |
Open |
Range |
Volume |
Thu 23 October 2025 |
96.62 (1.47%) |
94.66 |
91.11 - 97.72 |
0.436 times |
Tue 30 September 2025 |
95.22 (0.95%) |
93.26 |
92.85 - 97.33 |
0.917 times |
Fri 29 August 2025 |
94.32 (8.65%) |
85.66 |
84.58 - 95.33 |
0.8383 times |
Thu 31 July 2025 |
86.81 (1.45%) |
85.17 |
85.10 - 90.84 |
0.7456 times |
Mon 30 June 2025 |
85.57 (3.94%) |
82.16 |
81.05 - 86.52 |
0.7929 times |
Fri 30 May 2025 |
82.33 (4.24%) |
79.10 |
78.81 - 85.55 |
1.3207 times |
Wed 30 April 2025 |
78.98 (-5.88%) |
83.53 |
70.61 - 85.27 |
1.8801 times |
Mon 31 March 2025 |
83.91 (-6.54%) |
89.92 |
82.34 - 90.35 |
0.992 times |
Fri 28 February 2025 |
89.78 (-5.56%) |
93.02 |
88.68 - 95.58 |
0.9866 times |
Fri 31 January 2025 |
95.07 (1.86%) |
94.35 |
90.09 - 97.00 |
1.0908 times |
Tue 31 December 2024 |
93.33 (-7.17%) |
100.97 |
91.84 - 101.00 |
0.7406 times |
DMA SMA EMA moving averages of S P VIOV
DMA (daily moving average) of S P VIOV
| DMA period | DMA value | | 5 day DMA | 95.48 | | 12 day DMA | 94.7 | | 20 day DMA | 95.06 | | 35 day DMA | 95.2 | | 50 day DMA | 94.61 | | 100 day DMA | 90.85 | | 150 day DMA | 87.21 | | 200 day DMA | 88.24 | EMA (exponential moving average) of S P VIOV
| EMA period | EMA current | EMA prev | EMA prev2 | | 5 day EMA | 95.66 | 95.18 | 95.08 | | 12 day EMA | 95.2 | 94.94 | 94.86 | | 20 day EMA | 95.04 | 94.87 | 94.82 | | 35 day EMA | 94.61 | 94.49 | 94.44 | | 50 day EMA | 94.32 | 94.23 | 94.18 |
SMA (simple moving average) of S P VIOV
| SMA period | SMA current | SMA prev | SMA prev2 | | 5 day SMA | 95.48 | 95.01 | 95.01 | | 12 day SMA | 94.7 | 94.54 | 94.62 | | 20 day SMA | 95.06 | 94.92 | 94.89 | | 35 day SMA | 95.2 | 95.16 | 95.11 | | 50 day SMA | 94.61 | 94.51 | 94.46 | | 100 day SMA | 90.85 | 90.71 | 90.58 | | 150 day SMA | 87.21 | 87.14 | 87.07 | | 200 day SMA | 88.24 | 88.23 | 88.21 |
|
|
