InformationTechnology VGT full analysis,charts,indicators,moving averages,SMA,DMA,EMA,ADX,MACD,RSIInformation Technology VGT WideScreen charts, DMA,SMA,EMA technical analysis, forecast prediction, by indicators ADX,MACD,RSI,CCI AMEX stock exchange
Daily price and charts and targets InformationTechnology Strong Daily Stock price targets for InformationTechnology VGT are 755.77 and 770.07 | Daily Target 1 | 744.11 | | Daily Target 2 | 753.13 | | Daily Target 3 | 758.40666666667 | | Daily Target 4 | 767.43 | | Daily Target 5 | 772.71 |
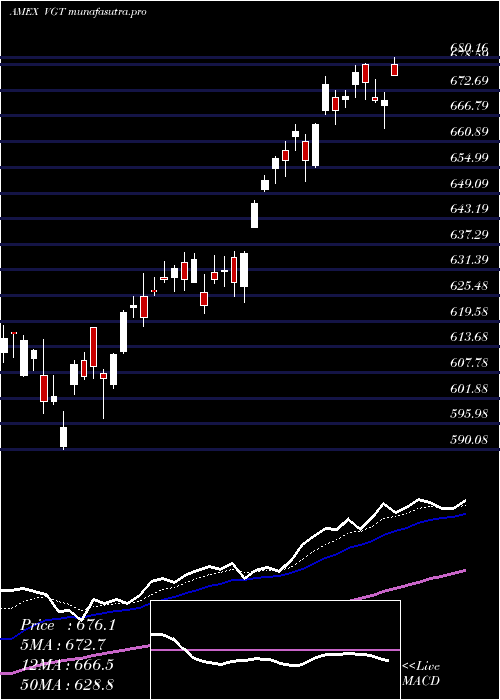
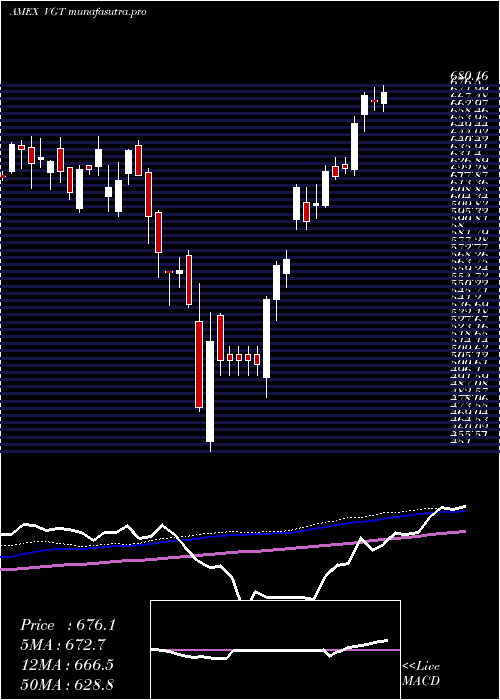
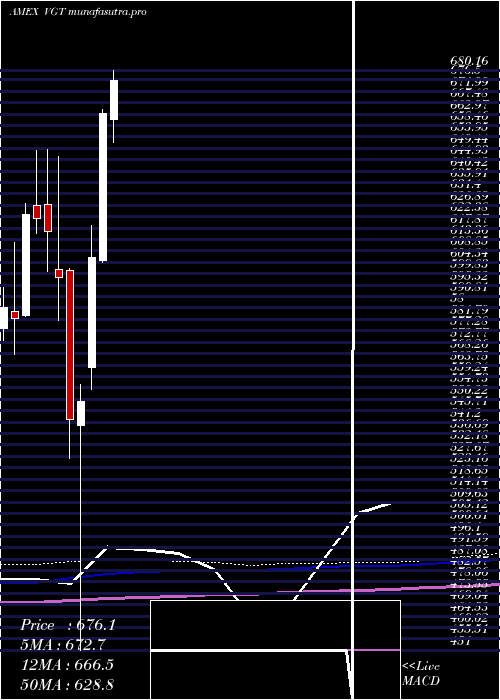
Daily price and volume Information Technology
| Date |
Closing |
Open |
Range |
Volume |
Thu 23 October 2025 |
762.16 (1.3%) |
751.02 |
749.38 - 763.68 |
0.4927 times |
Wed 22 October 2025 |
752.36 (-1.19%) |
760.46 |
742.81 - 762.26 |
0.8572 times |
Tue 21 October 2025 |
761.41 (0.01%) |
761.50 |
757.69 - 764.48 |
0.7979 times |
Mon 20 October 2025 |
761.31 (1.22%) |
752.70 |
752.70 - 764.72 |
0.6003 times |
Fri 17 October 2025 |
752.16 (0.24%) |
745.26 |
741.37 - 753.83 |
0.9514 times |
Thu 16 October 2025 |
750.35 (-0.32%) |
757.02 |
745.26 - 759.40 |
1.1081 times |
Wed 15 October 2025 |
752.77 (0.93%) |
756.56 |
742.77 - 758.70 |
1.045 times |
Tue 14 October 2025 |
745.84 (-1.28%) |
744.95 |
736.50 - 752.70 |
1.5609 times |
Mon 13 October 2025 |
755.49 (0.04%) |
753.79 |
748.71 - 757.39 |
1.3875 times |
Tue 07 October 2025 |
755.19 (-0.92%) |
766.09 |
750.72 - 766.88 |
1.1991 times |
Mon 06 October 2025 |
762.18 (0.86%) |
758.63 |
758.00 - 766.19 |
0.7515 times |
Weekly price and charts InformationTechnology Strong weekly Stock price targets for InformationTechnology VGT are 752.49 and 774.4 | Weekly Target 1 | 734.65 | | Weekly Target 2 | 748.41 | | Weekly Target 3 | 756.56333333333 | | Weekly Target 4 | 770.32 | | Weekly Target 5 | 778.47 |
Weekly price and volumes for Information Technology
| Date |
Closing |
Open |
Range |
Volume |
Thu 23 October 2025 |
762.16 (1.33%) |
752.70 |
742.81 - 764.72 |
0.6475 times |
Fri 17 October 2025 |
752.16 (-0.4%) |
753.79 |
736.50 - 759.40 |
1.4263 times |
Tue 07 October 2025 |
755.19 (-0.06%) |
758.63 |
750.72 - 766.88 |
0.4596 times |
Fri 03 October 2025 |
755.67 (2.3%) |
744.09 |
740.80 - 762.83 |
1.0554 times |
Fri 26 September 2025 |
738.70 (-0.33%) |
739.95 |
726.26 - 753.59 |
1.5102 times |
Fri 19 September 2025 |
741.17 (3%) |
720.85 |
713.84 - 741.80 |
1.1669 times |
Fri 12 September 2025 |
719.57 (2.97%) |
702.58 |
700.50 - 721.45 |
1.1203 times |
Fri 05 September 2025 |
698.79 (0.25%) |
683.61 |
680.10 - 704.00 |
0.9755 times |
Fri 29 August 2025 |
697.02 (0%) |
704.94 |
694.50 - 704.94 |
0.3229 times |
Fri 29 August 2025 |
697.02 (0.41%) |
692.93 |
690.53 - 709.46 |
1.3154 times |
Fri 22 August 2025 |
694.17 (-0.84%) |
699.72 |
672.88 - 702.51 |
1.5158 times |
Monthly price and charts InformationTechnology Strong monthly Stock price targets for InformationTechnology VGT are 749.33 and 779.71 | Monthly Target 1 | 724.8 | | Monthly Target 2 | 743.48 | | Monthly Target 3 | 755.18 | | Monthly Target 4 | 773.86 | | Monthly Target 5 | 785.56 |
Monthly price and volumes Information Technology
| Date |
Closing |
Open |
Range |
Volume |
Thu 23 October 2025 |
762.16 (2.08%) |
743.21 |
736.50 - 766.88 |
0.4777 times |
Tue 30 September 2025 |
746.63 (7.12%) |
683.61 |
680.10 - 753.59 |
0.8251 times |
Fri 29 August 2025 |
697.02 (0.95%) |
683.16 |
671.11 - 710.88 |
0.9666 times |
Thu 31 July 2025 |
690.47 (4.1%) |
660.86 |
651.75 - 705.26 |
0.7851 times |
Mon 30 June 2025 |
663.28 (9.39%) |
605.00 |
604.07 - 664.76 |
0.8412 times |
Fri 30 May 2025 |
606.37 (10.36%) |
562.75 |
553.87 - 618.69 |
1.0165 times |
Wed 30 April 2025 |
549.45 (1.3%) |
540.00 |
451.00 - 556.23 |
1.752 times |
Mon 31 March 2025 |
542.38 (-9.37%) |
600.93 |
526.90 - 601.99 |
1.2399 times |
Fri 28 February 2025 |
598.48 (-2.94%) |
601.51 |
581.29 - 646.27 |
0.8966 times |
Fri 31 January 2025 |
616.61 (-0.83%) |
627.00 |
600.65 - 648.76 |
1.1993 times |
Tue 31 December 2024 |
621.80 (-0.22%) |
626.70 |
615.91 - 648.66 |
0.8006 times |
DMA SMA EMA moving averages of Information Technology VGT
DMA (daily moving average) of Information Technology VGT
| DMA period | DMA value | | 5 day DMA | 757.88 | | 12 day DMA | 755.57 | | 20 day DMA | 751.36 | | 35 day DMA | 736.32 | | 50 day DMA | 724.63 | | 100 day DMA | 691.94 | | 150 day DMA | 644.93 | | 200 day DMA | 636.47 | EMA (exponential moving average) of Information Technology VGT
| EMA period | EMA current | EMA prev | EMA prev2 | | 5 day EMA | 757.75 | 755.55 | 757.14 | | 12 day EMA | 754.37 | 752.96 | 753.07 | | 20 day EMA | 749.18 | 747.81 | 747.33 | | 35 day EMA | 737.68 | 736.24 | 735.29 | | 50 day EMA | 725.32 | 723.82 | 722.66 |
SMA (simple moving average) of Information Technology VGT
| SMA period | SMA current | SMA prev | SMA prev2 | | 5 day SMA | 757.88 | 755.52 | 755.6 | | 12 day SMA | 755.57 | 755.23 | 755.24 | | 20 day SMA | 751.36 | 750.91 | 750.35 | | 35 day SMA | 736.32 | 734.46 | 732.87 | | 50 day SMA | 724.63 | 723.29 | 722.23 | | 100 day SMA | 691.94 | 690.42 | 688.85 | | 150 day SMA | 644.93 | 643.63 | 642.37 | | 200 day SMA | 636.47 | 635.82 | 635.16 |
|
|
