WellingtonFund VFVA full analysis,charts,indicators,moving averages,SMA,DMA,EMA,ADX,MACD,RSIWellington Fund VFVA WideScreen charts, DMA,SMA,EMA technical analysis, forecast prediction, by indicators ADX,MACD,RSI,CCI AMEX stock exchange
Daily price and charts and targets WellingtonFund Strong Daily Stock price targets for WellingtonFund VFVA are 128.4 and 129.07 | Daily Target 1 | 127.91 | | Daily Target 2 | 128.21 | | Daily Target 3 | 128.58333333333 | | Daily Target 4 | 128.88 | | Daily Target 5 | 129.25 |
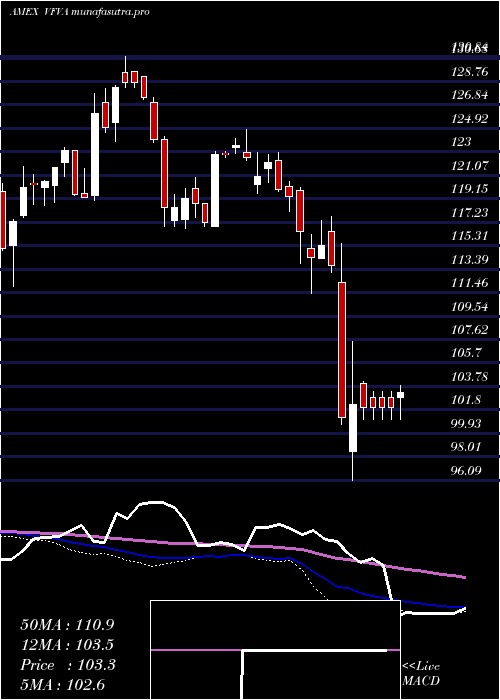
Daily price and volume Wellington Fund
| Date |
Closing |
Open |
Range |
Volume |
Fri 24 October 2025 |
128.50 (0.69%) |
128.46 |
128.29 - 128.96 |
1.2712 times |
Thu 23 October 2025 |
127.62 (0.35%) |
127.16 |
126.94 - 127.84 |
0.699 times |
Wed 22 October 2025 |
127.17 (-0.24%) |
127.37 |
126.55 - 127.83 |
0.5459 times |
Tue 21 October 2025 |
127.47 (0.77%) |
126.45 |
126.45 - 127.80 |
2.4593 times |
Mon 20 October 2025 |
126.50 (1.33%) |
125.28 |
125.28 - 126.59 |
0.9936 times |
Fri 17 October 2025 |
124.84 (0.49%) |
124.20 |
124.08 - 124.89 |
1.0173 times |
Thu 16 October 2025 |
124.23 (-1.57%) |
126.33 |
123.83 - 126.33 |
0.4075 times |
Wed 15 October 2025 |
126.21 (-0.13%) |
127.01 |
125.58 - 127.53 |
0.7838 times |
Tue 14 October 2025 |
126.37 (1.49%) |
122.92 |
122.92 - 126.82 |
0.5781 times |
Mon 13 October 2025 |
124.52 (1.33%) |
124.35 |
123.52 - 124.64 |
1.2443 times |
Fri 10 October 2025 |
122.89 (-3.06%) |
126.83 |
122.89 - 126.83 |
1.2639 times |

Weekly price and charts WellingtonFund Strong weekly Stock price targets for WellingtonFund VFVA are 126.89 and 130.57 | Weekly Target 1 | 123.9 | | Weekly Target 2 | 126.2 | | Weekly Target 3 | 127.58 | | Weekly Target 4 | 129.88 | | Weekly Target 5 | 131.26 |
Weekly price and volumes for Wellington Fund
| Date |
Closing |
Open |
Range |
Volume |
Fri 24 October 2025 |
128.50 (2.93%) |
125.28 |
125.28 - 128.96 |
0.9 times |
Fri 17 October 2025 |
124.84 (1.59%) |
124.35 |
122.92 - 127.53 |
0.6078 times |
Fri 10 October 2025 |
122.89 (-5.05%) |
130.04 |
122.89 - 130.04 |
0.8777 times |
Fri 03 October 2025 |
129.42 (1.27%) |
127.88 |
126.20 - 130.08 |
2.0659 times |
Fri 26 September 2025 |
127.80 (-0.37%) |
127.93 |
126.20 - 129.89 |
2.3267 times |
Fri 19 September 2025 |
128.28 (0.07%) |
128.59 |
127.10 - 130.32 |
0.7357 times |
Fri 12 September 2025 |
128.19 (-0.32%) |
129.00 |
126.86 - 129.69 |
0.7268 times |
Fri 05 September 2025 |
128.60 (0.27%) |
127.00 |
126.69 - 129.88 |
0.5628 times |
Fri 29 August 2025 |
128.26 (0%) |
127.91 |
127.91 - 128.79 |
0.2438 times |
Fri 29 August 2025 |
128.26 (0.27%) |
127.70 |
126.93 - 128.79 |
0.9528 times |
Fri 22 August 2025 |
127.92 (3.44%) |
123.62 |
123.21 - 128.14 |
7.9995 times |
Monthly price and charts WellingtonFund Strong monthly Stock price targets for WellingtonFund VFVA are 125.7 and 132.89 | Monthly Target 1 | 119.97 | | Monthly Target 2 | 124.23 | | Monthly Target 3 | 127.15666666667 | | Monthly Target 4 | 131.42 | | Monthly Target 5 | 134.35 |
Monthly price and volumes Wellington Fund
| Date |
Closing |
Open |
Range |
Volume |
Fri 24 October 2025 |
128.50 (0.75%) |
126.75 |
122.89 - 130.08 |
0.3592 times |
Tue 30 September 2025 |
127.54 (-0.56%) |
127.00 |
126.20 - 130.32 |
0.7424 times |
Fri 29 August 2025 |
128.26 (8.49%) |
116.85 |
115.61 - 128.79 |
1.3207 times |
Thu 31 July 2025 |
118.22 (-0.07%) |
118.07 |
118.07 - 124.43 |
0.4002 times |
Mon 30 June 2025 |
118.30 (4.13%) |
113.65 |
112.21 - 119.00 |
0.6775 times |
Fri 30 May 2025 |
113.61 (5.69%) |
107.49 |
107.06 - 117.40 |
1.2832 times |
Wed 30 April 2025 |
107.49 (-5.71%) |
114.06 |
96.09 - 115.47 |
2.844 times |
Mon 31 March 2025 |
114.00 (-4.47%) |
119.86 |
111.37 - 120.07 |
0.7216 times |
Fri 28 February 2025 |
119.34 (-2.64%) |
120.31 |
118.15 - 122.96 |
0.6653 times |
Fri 31 January 2025 |
122.57 (3.54%) |
119.64 |
116.88 - 124.85 |
0.9859 times |
Tue 31 December 2024 |
118.38 (-8%) |
129.17 |
116.69 - 129.17 |
0.5028 times |

DMA SMA EMA moving averages of Wellington Fund VFVA
DMA (daily moving average) of Wellington Fund VFVA
| DMA period | DMA value | | 5 day DMA | 127.45 | | 12 day DMA | 126.09 | | 20 day DMA | 126.93 | | 35 day DMA | 127.41 | | 50 day DMA | 127.25 | | 100 day DMA | 123.4 | | 150 day DMA | 118.69 | | 200 day DMA | 118.94 | EMA (exponential moving average) of Wellington Fund VFVA
| EMA period | EMA current | EMA prev | EMA prev2 | | 5 day EMA | 127.44 | 126.91 | 126.55 | | 12 day EMA | 126.91 | 126.62 | 126.44 | | 20 day EMA | 126.89 | 126.72 | 126.63 | | 35 day EMA | 126.81 | 126.71 | 126.66 | | 50 day EMA | 126.9 | 126.83 | 126.8 |
SMA (simple moving average) of Wellington Fund VFVA
| SMA period | SMA current | SMA prev | SMA prev2 | | 5 day SMA | 127.45 | 126.72 | 126.04 | | 12 day SMA | 126.09 | 126.04 | 126.05 | | 20 day SMA | 126.93 | 126.89 | 126.83 | | 35 day SMA | 127.41 | 127.41 | 127.43 | | 50 day SMA | 127.25 | 127.15 | 127.08 | | 100 day SMA | 123.4 | 123.25 | 123.11 | | 150 day SMA | 118.69 | 118.6 | 118.53 | | 200 day SMA | 118.94 | 118.9 | 118.85 |
|
|
