US VFMO full analysis,charts,indicators,moving averages,SMA,DMA,EMA,ADX,MACD,RSIU S VFMO WideScreen charts, DMA,SMA,EMA technical analysis, forecast prediction, by indicators ADX,MACD,RSI,CCI AMEX stock exchange
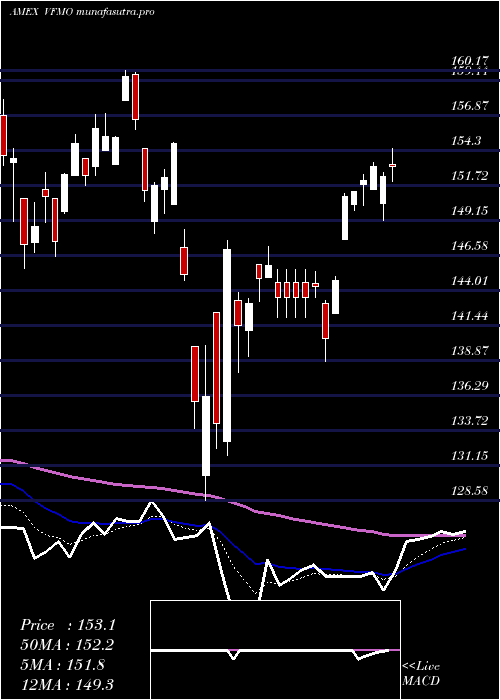
Daily price and charts and targets US Strong Daily Stock price targets for US VFMO are 193.32 and 196.44 | Daily Target 1 | 190.78 | | Daily Target 2 | 192.73 | | Daily Target 3 | 193.89666666667 | | Daily Target 4 | 195.85 | | Daily Target 5 | 197.02 |
Daily price and volume U S
| Date |
Closing |
Open |
Range |
Volume |
Thu 23 October 2025 |
194.69 (1.86%) |
191.94 |
191.94 - 195.06 |
0.6578 times |
Wed 22 October 2025 |
191.13 (-1.93%) |
193.94 |
188.74 - 194.27 |
0.547 times |
Tue 21 October 2025 |
194.89 (-0.7%) |
195.95 |
194.00 - 195.95 |
1.0634 times |
Mon 20 October 2025 |
196.26 (1.86%) |
195.83 |
195.21 - 196.49 |
0.5859 times |
Fri 17 October 2025 |
192.68 (-1.08%) |
192.84 |
190.85 - 193.82 |
1.2959 times |
Thu 16 October 2025 |
194.79 (-2.03%) |
200.00 |
194.18 - 200.02 |
0.9883 times |
Wed 15 October 2025 |
198.82 (0.84%) |
199.76 |
195.84 - 200.57 |
1.3187 times |
Tue 14 October 2025 |
197.17 (0.93%) |
193.19 |
191.56 - 198.71 |
1.2259 times |
Mon 13 October 2025 |
195.36 (2.94%) |
193.56 |
193.42 - 195.58 |
0.9333 times |
Fri 10 October 2025 |
189.78 (-2.77%) |
195.99 |
189.64 - 196.47 |
1.3838 times |
Thu 09 October 2025 |
195.19 (-0.31%) |
196.15 |
194.24 - 196.63 |
0.5944 times |
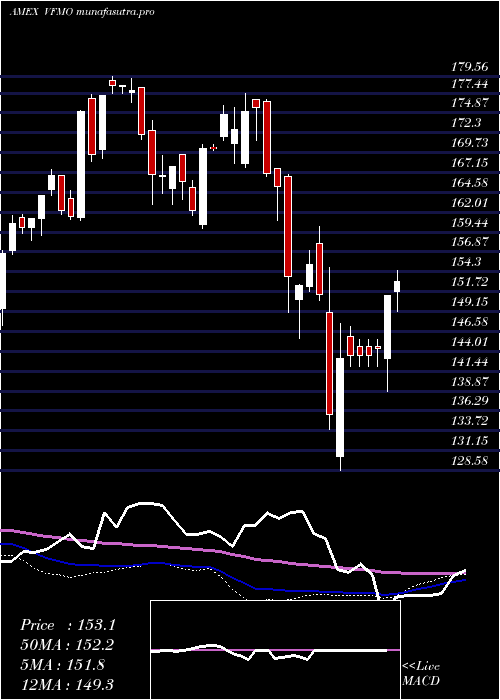
Weekly price and charts US Strong weekly Stock price targets for US VFMO are 187.84 and 195.59 | Weekly Target 1 | 185.56 | | Weekly Target 2 | 190.12 | | Weekly Target 3 | 193.30666666667 | | Weekly Target 4 | 197.87 | | Weekly Target 5 | 201.06 |
Weekly price and volumes for U S
| Date |
Closing |
Open |
Range |
Volume |
Thu 23 October 2025 |
194.69 (1.04%) |
195.83 |
188.74 - 196.49 |
0.551 times |
Fri 17 October 2025 |
192.68 (1.53%) |
193.56 |
190.85 - 200.57 |
1.1124 times |
Fri 10 October 2025 |
189.78 (-2.06%) |
195.96 |
189.64 - 196.63 |
0.894 times |
Fri 03 October 2025 |
193.78 (1.82%) |
192.17 |
189.83 - 195.17 |
0.6755 times |
Fri 26 September 2025 |
190.32 (-0.55%) |
191.37 |
186.24 - 194.50 |
0.8767 times |
Fri 19 September 2025 |
191.38 (2.75%) |
186.95 |
185.57 - 192.26 |
0.7566 times |
Fri 12 September 2025 |
186.26 (2.66%) |
182.17 |
182.11 - 187.19 |
0.7351 times |
Fri 05 September 2025 |
181.44 (0.2%) |
178.19 |
177.50 - 182.79 |
0.701 times |
Fri 29 August 2025 |
181.07 (0%) |
182.77 |
180.03 - 182.77 |
0.2618 times |
Fri 29 August 2025 |
181.07 (0.54%) |
179.71 |
179.22 - 183.23 |
3.436 times |
Fri 22 August 2025 |
180.09 (1.35%) |
178.00 |
172.91 - 180.95 |
0.7655 times |
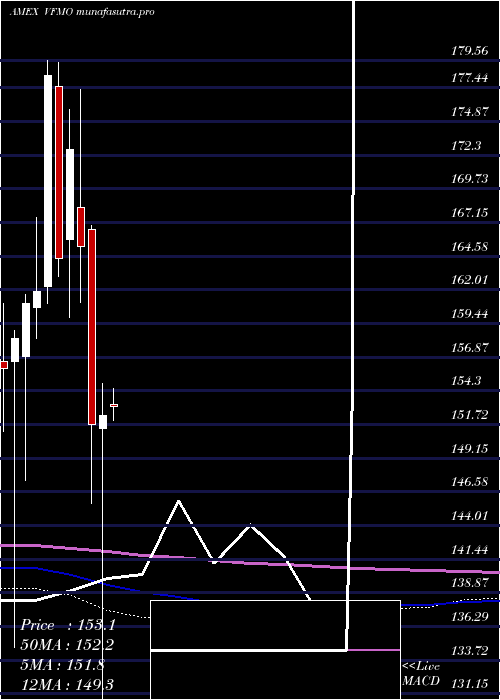
Monthly price and charts US Strong monthly Stock price targets for US VFMO are 191.72 and 203.55 | Monthly Target 1 | 182.84 | | Monthly Target 2 | 188.76 | | Monthly Target 3 | 194.66666666667 | | Monthly Target 4 | 200.59 | | Monthly Target 5 | 206.5 |
Monthly price and volumes U S
| Date |
Closing |
Open |
Range |
Volume |
Thu 23 October 2025 |
194.69 (1.61%) |
190.86 |
188.74 - 200.57 |
0.4313 times |
Tue 30 September 2025 |
191.60 (5.82%) |
178.19 |
177.50 - 194.50 |
0.4745 times |
Fri 29 August 2025 |
181.07 (3.59%) |
172.21 |
170.03 - 183.23 |
0.922 times |
Thu 31 July 2025 |
174.80 (1.32%) |
172.05 |
169.95 - 177.25 |
0.5628 times |
Mon 30 June 2025 |
172.52 (4.92%) |
164.01 |
162.79 - 172.61 |
0.5835 times |
Fri 30 May 2025 |
164.43 (7.9%) |
153.29 |
152.04 - 165.30 |
0.8628 times |
Wed 30 April 2025 |
152.39 (0.45%) |
151.39 |
128.58 - 154.86 |
1.4969 times |
Mon 31 March 2025 |
151.71 (-8.23%) |
166.62 |
145.65 - 166.95 |
1.2039 times |
Fri 28 February 2025 |
165.31 (-4.29%) |
168.28 |
161.00 - 177.31 |
1.5301 times |
Fri 31 January 2025 |
172.72 (5.08%) |
165.83 |
159.88 - 175.78 |
1.9322 times |
Tue 31 December 2024 |
164.37 (-7.86%) |
177.57 |
163.00 - 179.37 |
1.08 times |
DMA SMA EMA moving averages of U S VFMO
DMA (daily moving average) of U S VFMO
| DMA period | DMA value | | 5 day DMA | 193.93 | | 12 day DMA | 194.71 | | 20 day DMA | 193.92 | | 35 day DMA | 191.17 | | 50 day DMA | 187.64 | | 100 day DMA | 179.79 | | 150 day DMA | 170.87 | | 200 day DMA | 169.7 | EMA (exponential moving average) of U S VFMO
| EMA period | EMA current | EMA prev | EMA prev2 | | 5 day EMA | 194.09 | 193.79 | 195.12 | | 12 day EMA | 194.14 | 194.04 | 194.57 | | 20 day EMA | 193.25 | 193.1 | 193.31 | | 35 day EMA | 190.51 | 190.26 | 190.21 | | 50 day EMA | 187.46 | 187.16 | 187 |
SMA (simple moving average) of U S VFMO
| SMA period | SMA current | SMA prev | SMA prev2 | | 5 day SMA | 193.93 | 193.95 | 195.49 | | 12 day SMA | 194.71 | 194.69 | 195.02 | | 20 day SMA | 193.92 | 193.62 | 193.57 | | 35 day SMA | 191.17 | 190.79 | 190.47 | | 50 day SMA | 187.64 | 187.31 | 187.09 | | 100 day SMA | 179.79 | 179.48 | 179.21 | | 150 day SMA | 170.87 | 170.61 | 170.35 | | 200 day SMA | 169.7 | 169.56 | 169.44 |
|
|
