DelawareFlorida VFL full analysis,charts,indicators,moving averages,SMA,DMA,EMA,ADX,MACD,RSIDelaware Florida VFL WideScreen charts, DMA,SMA,EMA technical analysis, forecast prediction, by indicators ADX,MACD,RSI,CCI AMEX stock exchange
Daily price and charts and targets DelawareFlorida Strong Daily Stock price targets for DelawareFlorida VFL are 10.39 and 10.42 | Daily Target 1 | 10.38 | | Daily Target 2 | 10.39 | | Daily Target 3 | 10.406666666667 | | Daily Target 4 | 10.42 | | Daily Target 5 | 10.44 |
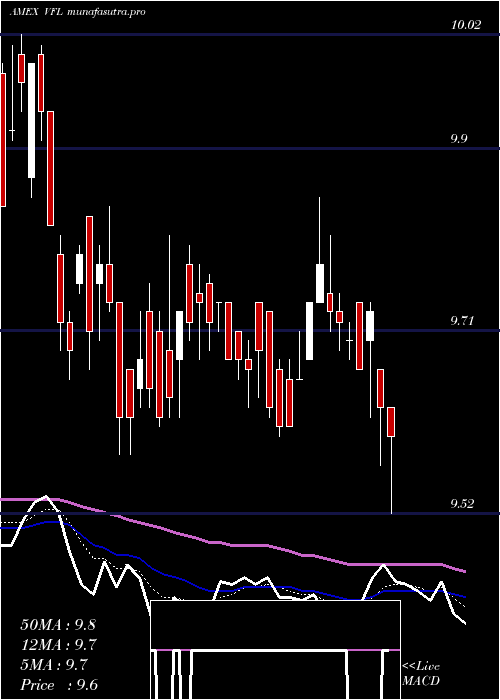
Daily price and volume Delaware Florida
| Date |
Closing |
Open |
Range |
Volume |
Thu 23 October 2025 |
10.41 (0.19%) |
10.42 |
10.39 - 10.42 |
0.3488 times |
Wed 22 October 2025 |
10.39 (0%) |
10.39 |
10.36 - 10.48 |
1.7297 times |
Tue 21 October 2025 |
10.39 (0.87%) |
10.36 |
10.34 - 10.42 |
0.8045 times |
Mon 20 October 2025 |
10.30 (0.29%) |
10.32 |
10.29 - 10.39 |
2.1802 times |
Fri 17 October 2025 |
10.27 (-0.48%) |
10.27 |
10.26 - 10.33 |
1.0565 times |
Thu 16 October 2025 |
10.32 (-0.1%) |
10.34 |
10.29 - 10.34 |
1.0577 times |
Wed 15 October 2025 |
10.33 (0.19%) |
10.28 |
10.28 - 10.39 |
0.808 times |
Tue 14 October 2025 |
10.31 (0.29%) |
10.24 |
10.24 - 10.32 |
0.8115 times |
Mon 13 October 2025 |
10.28 (0.29%) |
10.25 |
10.25 - 10.30 |
0.8362 times |
Fri 10 October 2025 |
10.25 (0.1%) |
10.27 |
10.23 - 10.27 |
0.3669 times |
Thu 09 October 2025 |
10.24 (0.39%) |
10.21 |
10.19 - 10.28 |
1.6654 times |
Weekly price and charts DelawareFlorida Strong weekly Stock price targets for DelawareFlorida VFL are 10.35 and 10.54 | Weekly Target 1 | 10.2 | | Weekly Target 2 | 10.31 | | Weekly Target 3 | 10.393333333333 | | Weekly Target 4 | 10.5 | | Weekly Target 5 | 10.58 |
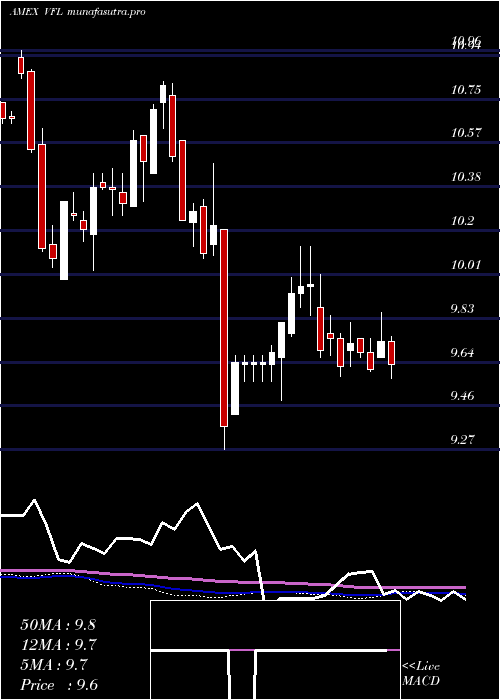
Weekly price and volumes for Delaware Florida
| Date |
Closing |
Open |
Range |
Volume |
Thu 23 October 2025 |
10.41 (1.36%) |
10.32 |
10.29 - 10.48 |
1.0231 times |
Fri 17 October 2025 |
10.27 (0.2%) |
10.25 |
10.24 - 10.39 |
0.9234 times |
Fri 10 October 2025 |
10.25 (0.2%) |
10.18 |
10.03 - 10.28 |
0.8217 times |
Fri 03 October 2025 |
10.23 (0.69%) |
10.23 |
10.15 - 10.34 |
0.3853 times |
Fri 26 September 2025 |
10.16 (-1.65%) |
10.36 |
10.11 - 10.36 |
1.3318 times |
Fri 19 September 2025 |
10.33 (0.68%) |
10.31 |
10.27 - 10.42 |
0.9974 times |
Fri 12 September 2025 |
10.26 (3.12%) |
9.98 |
9.95 - 10.31 |
1.3197 times |
Fri 05 September 2025 |
9.95 (3.65%) |
9.60 |
9.56 - 9.95 |
1.3846 times |
Fri 29 August 2025 |
9.60 (0%) |
9.59 |
9.56 - 9.69 |
0.3087 times |
Fri 29 August 2025 |
9.60 (0.42%) |
9.57 |
9.51 - 9.69 |
1.5043 times |
Fri 22 August 2025 |
9.56 (-0.21%) |
9.60 |
9.49 - 9.66 |
1.1372 times |
Monthly price and charts DelawareFlorida Strong monthly Stock price targets for DelawareFlorida VFL are 10.22 and 10.67 | Monthly Target 1 | 9.86 | | Monthly Target 2 | 10.13 | | Monthly Target 3 | 10.306666666667 | | Monthly Target 4 | 10.58 | | Monthly Target 5 | 10.76 |
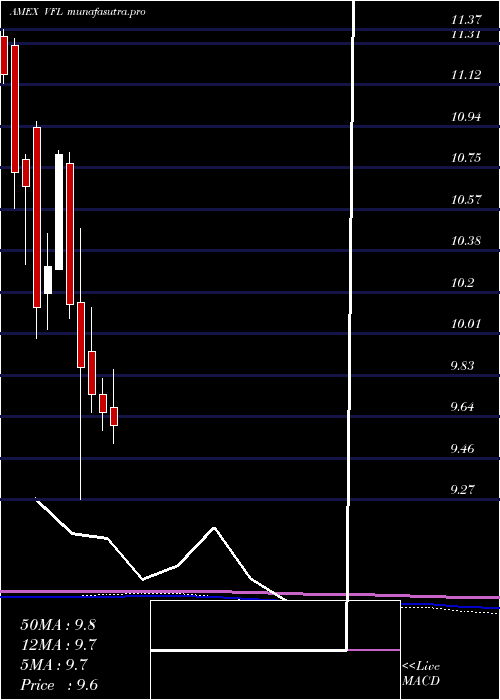
Monthly price and volumes Delaware Florida
| Date |
Closing |
Open |
Range |
Volume |
Thu 23 October 2025 |
10.41 (1.46%) |
10.31 |
10.03 - 10.48 |
0.5617 times |
Tue 30 September 2025 |
10.26 (6.88%) |
9.60 |
9.56 - 10.42 |
0.994 times |
Fri 29 August 2025 |
9.60 (0.95%) |
9.51 |
9.49 - 9.74 |
1.1078 times |
Thu 31 July 2025 |
9.51 (-1.55%) |
9.68 |
9.38 - 9.85 |
1.5476 times |
Mon 30 June 2025 |
9.66 (-0.82%) |
9.74 |
9.58 - 9.81 |
0.9784 times |
Fri 30 May 2025 |
9.74 (-1.22%) |
9.93 |
9.66 - 10.13 |
0.6627 times |
Wed 30 April 2025 |
9.86 (-2.76%) |
10.15 |
9.27 - 10.48 |
1.4108 times |
Mon 31 March 2025 |
10.14 (-6.2%) |
10.77 |
10.08 - 10.82 |
0.9454 times |
Fri 28 February 2025 |
10.81 (4.85%) |
10.30 |
10.30 - 10.83 |
0.7512 times |
Fri 31 January 2025 |
10.31 (1.78%) |
10.19 |
10.03 - 10.46 |
1.0405 times |
Tue 31 December 2024 |
10.13 (-5.06%) |
10.93 |
9.99 - 10.96 |
1.5294 times |
DMA SMA EMA moving averages of Delaware Florida VFL
DMA (daily moving average) of Delaware Florida VFL
| DMA period | DMA value | | 5 day DMA | 10.35 | | 12 day DMA | 10.31 | | 20 day DMA | 10.26 | | 35 day DMA | 10.24 | | 50 day DMA | 10.04 | | 100 day DMA | 9.83 | | 150 day DMA | 9.84 | | 200 day DMA | 9.99 | EMA (exponential moving average) of Delaware Florida VFL
| EMA period | EMA current | EMA prev | EMA prev2 | | 5 day EMA | 10.36 | 10.34 | 10.32 | | 12 day EMA | 10.32 | 10.3 | 10.28 | | 20 day EMA | 10.27 | 10.26 | 10.25 | | 35 day EMA | 10.16 | 10.14 | 10.12 | | 50 day EMA | 10.04 | 10.02 | 10.01 |
SMA (simple moving average) of Delaware Florida VFL
| SMA period | SMA current | SMA prev | SMA prev2 | | 5 day SMA | 10.35 | 10.33 | 10.32 | | 12 day SMA | 10.31 | 10.28 | 10.25 | | 20 day SMA | 10.26 | 10.25 | 10.24 | | 35 day SMA | 10.24 | 10.22 | 10.2 | | 50 day SMA | 10.04 | 10.03 | 10.01 | | 100 day SMA | 9.83 | 9.82 | 9.82 | | 150 day SMA | 9.84 | 9.83 | 9.83 | | 200 day SMA | 9.99 | 9.99 | 9.99 |
|
|
