FinancialEtf VFH full analysis,charts,indicators,moving averages,SMA,DMA,EMA,ADX,MACD,RSIFinancial Etf VFH WideScreen charts, DMA,SMA,EMA technical analysis, forecast prediction, by indicators ADX,MACD,RSI,CCI AMEX stock exchange
Daily price and charts and targets FinancialEtf Strong Daily Stock price targets for FinancialEtf VFH are 129.1 and 130.16 | Daily Target 1 | 128.27 | | Daily Target 2 | 128.87 | | Daily Target 3 | 129.33333333333 | | Daily Target 4 | 129.93 | | Daily Target 5 | 130.39 |
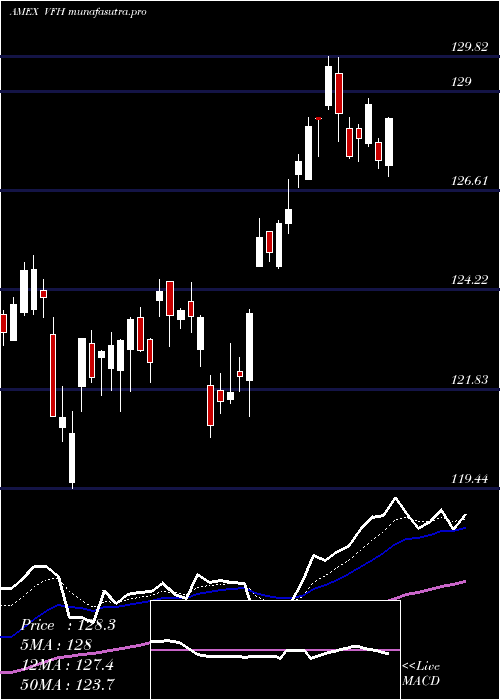
Daily price and volume Financial Etf
| Date |
Closing |
Open |
Range |
Volume |
Fri 24 October 2025 |
129.46 (1.12%) |
128.76 |
128.74 - 129.80 |
0.5058 times |
Thu 23 October 2025 |
128.02 (0.26%) |
128.42 |
127.37 - 128.42 |
0.4641 times |
Wed 22 October 2025 |
127.69 (-0.58%) |
128.61 |
127.02 - 128.61 |
1.5167 times |
Tue 21 October 2025 |
128.44 (-0.02%) |
128.28 |
128.24 - 129.35 |
1.2595 times |
Mon 20 October 2025 |
128.47 (1.3%) |
128.15 |
127.26 - 128.70 |
0.7939 times |
Fri 17 October 2025 |
126.82 (0.85%) |
126.07 |
125.73 - 127.23 |
0.9486 times |
Thu 16 October 2025 |
125.75 (-2.97%) |
129.30 |
125.23 - 129.30 |
1.5544 times |
Wed 15 October 2025 |
129.60 (-0.23%) |
130.55 |
128.79 - 131.02 |
1.4057 times |
Tue 14 October 2025 |
129.90 (1.33%) |
127.54 |
127.27 - 130.78 |
0.9489 times |
Mon 13 October 2025 |
128.19 (-2.11%) |
127.90 |
127.42 - 128.54 |
0.6023 times |
Tue 07 October 2025 |
130.95 (0.07%) |
131.49 |
130.47 - 131.77 |
0.6521 times |
Weekly price and charts FinancialEtf Strong weekly Stock price targets for FinancialEtf VFH are 128.24 and 131.02 | Weekly Target 1 | 125.98 | | Weekly Target 2 | 127.72 | | Weekly Target 3 | 128.76 | | Weekly Target 4 | 130.5 | | Weekly Target 5 | 131.54 |
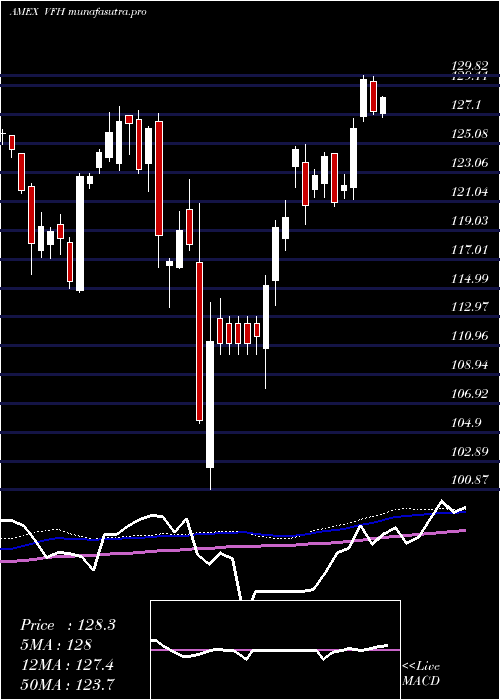
Weekly price and volumes for Financial Etf
| Date |
Closing |
Open |
Range |
Volume |
Fri 24 October 2025 |
129.46 (2.08%) |
128.15 |
127.02 - 129.80 |
1.045 times |
Fri 17 October 2025 |
126.82 (-3.15%) |
127.90 |
125.23 - 131.02 |
1.2567 times |
Tue 07 October 2025 |
130.95 (-0.04%) |
131.49 |
129.96 - 131.89 |
0.3064 times |
Fri 03 October 2025 |
131.00 (-0.4%) |
132.06 |
129.26 - 132.28 |
1.2227 times |
Fri 26 September 2025 |
131.53 (-0.94%) |
132.09 |
130.12 - 133.85 |
1.508 times |
Fri 19 September 2025 |
132.78 (0.85%) |
132.05 |
130.25 - 133.50 |
1.2465 times |
Fri 12 September 2025 |
131.66 (1.29%) |
130.03 |
129.46 - 132.40 |
1.4781 times |
Fri 05 September 2025 |
129.98 (-1.51%) |
131.09 |
129.40 - 132.75 |
0.6629 times |
Fri 29 August 2025 |
131.97 (0%) |
131.83 |
131.59 - 132.34 |
0.281 times |
Fri 29 August 2025 |
131.97 (0.62%) |
130.94 |
130.08 - 132.34 |
0.9927 times |
Fri 22 August 2025 |
131.16 (2.2%) |
128.18 |
127.87 - 131.45 |
0.8205 times |
Monthly price and charts FinancialEtf Strong monthly Stock price targets for FinancialEtf VFH are 124.02 and 130.68 | Monthly Target 1 | 122.2 | | Monthly Target 2 | 125.83 | | Monthly Target 3 | 128.86 | | Monthly Target 4 | 132.49 | | Monthly Target 5 | 135.52 |
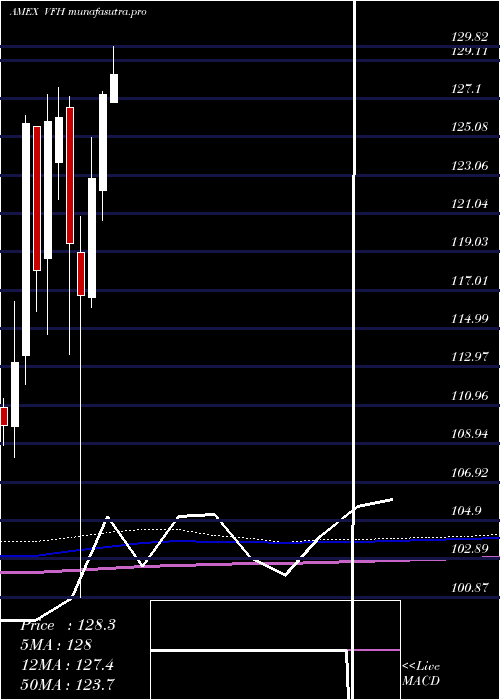
Monthly price and volumes Financial Etf
| Date |
Closing |
Open |
Range |
Volume |
Fri 24 October 2025 |
129.46 (-1.36%) |
130.67 |
125.23 - 131.89 |
0.6611 times |
Tue 30 September 2025 |
131.24 (-0.55%) |
131.09 |
129.40 - 133.85 |
1.2278 times |
Fri 29 August 2025 |
131.97 (3.28%) |
126.08 |
124.18 - 132.34 |
1.1133 times |
Thu 31 July 2025 |
127.78 (0.38%) |
126.87 |
125.19 - 130.43 |
1.0335 times |
Mon 30 June 2025 |
127.30 (3.6%) |
122.27 |
120.67 - 127.46 |
0.7481 times |
Fri 30 May 2025 |
122.88 (5.29%) |
116.62 |
116.10 - 125.04 |
0.8283 times |
Wed 30 April 2025 |
116.71 (-2.31%) |
118.98 |
100.87 - 120.90 |
1.324 times |
Mon 31 March 2025 |
119.47 (-5.27%) |
126.62 |
113.65 - 127.21 |
1.1252 times |
Fri 28 February 2025 |
126.11 (0.18%) |
123.71 |
121.76 - 127.67 |
0.8324 times |
Fri 31 January 2025 |
125.88 (6.61%) |
118.67 |
114.70 - 127.29 |
1.1064 times |
Tue 31 December 2024 |
118.07 (-6.13%) |
125.62 |
115.91 - 125.62 |
0.7568 times |
DMA SMA EMA moving averages of Financial Etf VFH
DMA (daily moving average) of Financial Etf VFH
| DMA period | DMA value | | 5 day DMA | 128.42 | | 12 day DMA | 128.68 | | 20 day DMA | 129.58 | | 35 day DMA | 130.41 | | 50 day DMA | 130.35 | | 100 day DMA | 128.24 | | 150 day DMA | 124.44 | | 200 day DMA | 123.91 | EMA (exponential moving average) of Financial Etf VFH
| EMA period | EMA current | EMA prev | EMA prev2 | | 5 day EMA | 128.51 | 128.03 | 128.04 | | 12 day EMA | 128.8 | 128.68 | 128.8 | | 20 day EMA | 129.26 | 129.24 | 129.37 | | 35 day EMA | 129.54 | 129.55 | 129.64 | | 50 day EMA | 129.86 | 129.88 | 129.96 |
SMA (simple moving average) of Financial Etf VFH
| SMA period | SMA current | SMA prev | SMA prev2 | | 5 day SMA | 128.42 | 127.89 | 127.43 | | 12 day SMA | 128.68 | 128.81 | 128.98 | | 20 day SMA | 129.58 | 129.71 | 129.94 | | 35 day SMA | 130.41 | 130.46 | 130.57 | | 50 day SMA | 130.35 | 130.33 | 130.3 | | 100 day SMA | 128.24 | 128.17 | 128.12 | | 150 day SMA | 124.44 | 124.36 | 124.3 | | 200 day SMA | 123.91 | 123.86 | 123.81 |
|
|
