GlobalAgriculture VEGI full analysis,charts,indicators,moving averages,SMA,DMA,EMA,ADX,MACD,RSIGlobal Agriculture VEGI WideScreen charts, DMA,SMA,EMA technical analysis, forecast prediction, by indicators ADX,MACD,RSI,CCI AMEX stock exchange
Daily price and charts and targets GlobalAgriculture Strong Daily Stock price targets for GlobalAgriculture VEGI are 39.68 and 39.86 | Daily Target 1 | 39.54 | | Daily Target 2 | 39.63 | | Daily Target 3 | 39.72 | | Daily Target 4 | 39.81 | | Daily Target 5 | 39.9 |
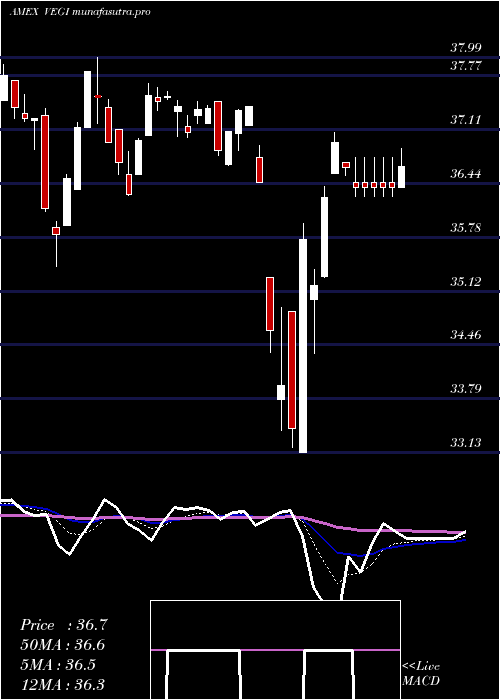
Daily price and volume Global Agriculture
| Date |
Closing |
Open |
Range |
Volume |
Fri 24 October 2025 |
39.72 (0.61%) |
39.70 |
39.63 - 39.81 |
0.7251 times |
Thu 23 October 2025 |
39.48 (0.95%) |
39.27 |
39.20 - 39.61 |
0.5095 times |
Wed 22 October 2025 |
39.11 (0.51%) |
38.94 |
38.94 - 39.39 |
0.9433 times |
Tue 21 October 2025 |
38.91 (-0.97%) |
39.09 |
38.89 - 39.11 |
1.7279 times |
Mon 20 October 2025 |
39.29 (0.59%) |
39.12 |
39.12 - 39.35 |
1.5218 times |
Fri 17 October 2025 |
39.06 (0.54%) |
38.99 |
38.96 - 39.08 |
0.5388 times |
Thu 16 October 2025 |
38.85 (0.18%) |
38.88 |
38.72 - 39.00 |
0.3923 times |
Wed 15 October 2025 |
38.78 (0.67%) |
38.90 |
38.72 - 38.95 |
1.071 times |
Tue 14 October 2025 |
38.52 (0.31%) |
38.04 |
38.00 - 38.55 |
1.0567 times |
Mon 13 October 2025 |
38.40 (0.37%) |
38.56 |
38.39 - 38.66 |
1.5137 times |
Fri 10 October 2025 |
38.26 (-1.9%) |
38.86 |
38.23 - 39.01 |
3.4986 times |
Weekly price and charts GlobalAgriculture Strong weekly Stock price targets for GlobalAgriculture VEGI are 39.31 and 40.23 | Weekly Target 1 | 38.55 | | Weekly Target 2 | 39.14 | | Weekly Target 3 | 39.473333333333 | | Weekly Target 4 | 40.06 | | Weekly Target 5 | 40.39 |
Weekly price and volumes for Global Agriculture
| Date |
Closing |
Open |
Range |
Volume |
Fri 24 October 2025 |
39.72 (1.69%) |
39.12 |
38.89 - 39.81 |
0.7223 times |
Fri 17 October 2025 |
39.06 (2.09%) |
38.56 |
38.00 - 39.08 |
0.6085 times |
Fri 10 October 2025 |
38.26 (-2.94%) |
39.39 |
38.23 - 39.61 |
2.4088 times |
Fri 03 October 2025 |
39.42 (-0.03%) |
39.62 |
38.70 - 39.62 |
0.7909 times |
Fri 26 September 2025 |
39.43 (-0.83%) |
39.62 |
39.21 - 39.89 |
0.6271 times |
Fri 19 September 2025 |
39.76 (-1.07%) |
40.25 |
39.71 - 40.25 |
0.8305 times |
Fri 12 September 2025 |
40.19 (0.53%) |
40.07 |
39.89 - 40.39 |
1.0129 times |
Fri 05 September 2025 |
39.98 (-0.94%) |
39.90 |
39.64 - 40.28 |
1.87 times |
Fri 29 August 2025 |
40.36 (0%) |
40.53 |
40.27 - 40.68 |
0.2071 times |
Fri 29 August 2025 |
40.36 (-1.2%) |
40.76 |
40.27 - 40.94 |
0.9217 times |
Fri 22 August 2025 |
40.85 (2.33%) |
39.90 |
39.86 - 40.92 |
0.7355 times |

Monthly price and charts GlobalAgriculture Strong monthly Stock price targets for GlobalAgriculture VEGI are 38.86 and 40.67 | Monthly Target 1 | 37.37 | | Monthly Target 2 | 38.54 | | Monthly Target 3 | 39.176666666667 | | Monthly Target 4 | 40.35 | | Monthly Target 5 | 40.99 |
Monthly price and volumes Global Agriculture
| Date |
Closing |
Open |
Range |
Volume |
Fri 24 October 2025 |
39.72 (1.25%) |
39.11 |
38.00 - 39.81 |
0.6252 times |
Tue 30 September 2025 |
39.23 (-2.8%) |
39.90 |
39.15 - 40.39 |
0.7147 times |
Fri 29 August 2025 |
40.36 (-0.32%) |
40.29 |
39.38 - 40.94 |
1.2142 times |
Thu 31 July 2025 |
40.49 (0.6%) |
40.16 |
39.69 - 41.36 |
0.8994 times |
Mon 30 June 2025 |
40.25 (1.16%) |
39.85 |
39.76 - 41.13 |
1.2733 times |
Fri 30 May 2025 |
39.79 (5.91%) |
37.38 |
37.11 - 40.50 |
0.6691 times |
Wed 30 April 2025 |
37.57 (1.29%) |
37.06 |
33.13 - 37.75 |
1.3902 times |
Mon 31 March 2025 |
37.09 (-0.43%) |
37.28 |
35.42 - 37.99 |
1.0852 times |
Fri 28 February 2025 |
37.25 (-2.54%) |
37.72 |
36.50 - 38.23 |
1.1384 times |
Fri 31 January 2025 |
38.22 (7.87%) |
35.60 |
34.76 - 38.78 |
0.9903 times |
Tue 31 December 2024 |
35.43 (-7.81%) |
38.88 |
35.08 - 38.91 |
1.0943 times |

DMA SMA EMA moving averages of Global Agriculture VEGI
DMA (daily moving average) of Global Agriculture VEGI
| DMA period | DMA value | | 5 day DMA | 39.3 | | 12 day DMA | 38.95 | | 20 day DMA | 39.08 | | 35 day DMA | 39.4 | | 50 day DMA | 39.68 | | 100 day DMA | 40.06 | | 150 day DMA | 39.29 | | 200 day DMA | 38.79 | EMA (exponential moving average) of Global Agriculture VEGI
| EMA period | EMA current | EMA prev | EMA prev2 | | 5 day EMA | 39.35 | 39.17 | 39.02 | | 12 day EMA | 39.18 | 39.08 | 39.01 | | 20 day EMA | 39.21 | 39.16 | 39.13 | | 35 day EMA | 39.39 | 39.37 | 39.36 | | 50 day EMA | 39.67 | 39.67 | 39.68 |
SMA (simple moving average) of Global Agriculture VEGI
| SMA period | SMA current | SMA prev | SMA prev2 | | 5 day SMA | 39.3 | 39.17 | 39.04 | | 12 day SMA | 38.95 | 38.92 | 38.92 | | 20 day SMA | 39.08 | 39.06 | 39.05 | | 35 day SMA | 39.4 | 39.41 | 39.42 | | 50 day SMA | 39.68 | 39.68 | 39.68 | | 100 day SMA | 40.06 | 40.06 | 40.06 | | 150 day SMA | 39.29 | 39.27 | 39.26 | | 200 day SMA | 38.79 | 38.77 | 38.75 |
|
|
