EnergyEtf VDE full analysis,charts,indicators,moving averages,SMA,DMA,EMA,ADX,MACD,RSIEnergy Etf VDE WideScreen charts, DMA,SMA,EMA technical analysis, forecast prediction, by indicators ADX,MACD,RSI,CCI AMEX stock exchange
Daily price and charts and targets EnergyEtf Strong Daily Stock price targets for EnergyEtf VDE are 123.35 and 125.78 | Daily Target 1 | 122.94 | | Daily Target 2 | 123.76 | | Daily Target 3 | 125.36666666667 | | Daily Target 4 | 126.19 | | Daily Target 5 | 127.8 |
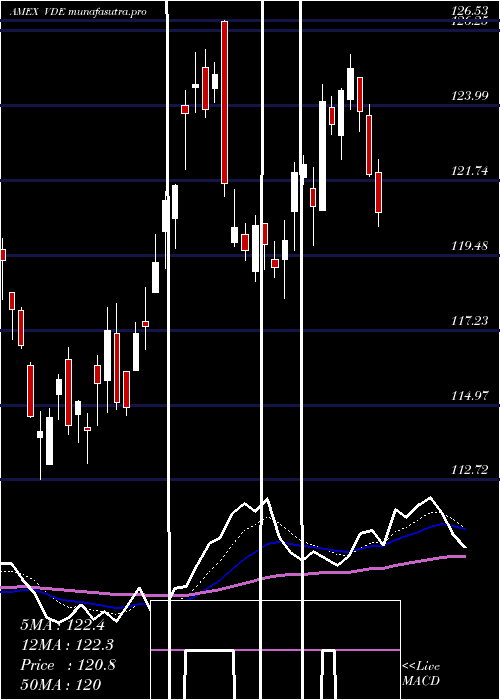
Daily price and volume Energy Etf
| Date |
Closing |
Open |
Range |
Volume |
Fri 24 October 2025 |
124.59 (-0.92%) |
126.97 |
124.54 - 126.97 |
0.6495 times |
Thu 23 October 2025 |
125.75 (1.62%) |
125.50 |
124.82 - 126.47 |
1.508 times |
Wed 22 October 2025 |
123.74 (1.17%) |
122.96 |
121.98 - 124.26 |
0.8142 times |
Tue 21 October 2025 |
122.31 (-0.33%) |
122.94 |
121.80 - 123.22 |
1.1538 times |
Mon 20 October 2025 |
122.71 (1.11%) |
121.36 |
121.36 - 123.00 |
0.5272 times |
Fri 17 October 2025 |
121.36 (0.62%) |
120.94 |
120.56 - 121.67 |
0.4289 times |
Thu 16 October 2025 |
120.61 (-1.33%) |
122.42 |
119.84 - 122.80 |
0.8837 times |
Wed 15 October 2025 |
122.24 (0.07%) |
122.93 |
121.28 - 123.80 |
1.5554 times |
Tue 14 October 2025 |
122.15 (-0.15%) |
120.59 |
120.42 - 122.85 |
1.4987 times |
Mon 13 October 2025 |
122.33 (1.63%) |
121.50 |
121.05 - 122.41 |
0.9805 times |
Fri 10 October 2025 |
120.37 (-2.98%) |
123.24 |
120.32 - 123.90 |
1.5871 times |
Weekly price and charts EnergyEtf Strong weekly Stock price targets for EnergyEtf VDE are 122.98 and 128.59 | Weekly Target 1 | 118.7 | | Weekly Target 2 | 121.64 | | Weekly Target 3 | 124.30666666667 | | Weekly Target 4 | 127.25 | | Weekly Target 5 | 129.92 |
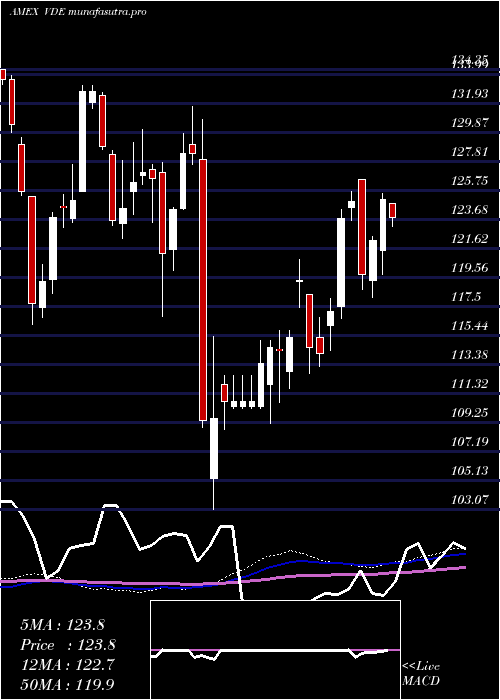
Weekly price and volumes for Energy Etf
| Date |
Closing |
Open |
Range |
Volume |
Fri 24 October 2025 |
124.59 (2.66%) |
121.36 |
121.36 - 126.97 |
0.7754 times |
Fri 17 October 2025 |
121.36 (0.82%) |
121.50 |
119.84 - 123.80 |
0.8912 times |
Fri 10 October 2025 |
120.37 (-4.14%) |
126.12 |
120.32 - 127.20 |
0.8915 times |
Fri 03 October 2025 |
125.57 (-3.15%) |
128.84 |
124.63 - 128.99 |
1.1253 times |
Fri 26 September 2025 |
129.65 (4.03%) |
124.12 |
123.78 - 130.92 |
1.4751 times |
Fri 19 September 2025 |
124.63 (-0.06%) |
124.87 |
124.12 - 127.66 |
1.1553 times |
Fri 12 September 2025 |
124.70 (1.37%) |
123.47 |
121.68 - 126.50 |
1.3781 times |
Fri 05 September 2025 |
123.02 (-3.05%) |
126.42 |
122.45 - 127.31 |
0.9872 times |
Fri 29 August 2025 |
126.89 (0%) |
126.50 |
126.25 - 127.27 |
0.1835 times |
Fri 29 August 2025 |
126.89 (2.51%) |
123.64 |
122.94 - 127.27 |
1.1374 times |
Fri 22 August 2025 |
123.78 (3.09%) |
119.57 |
118.62 - 124.07 |
1.0036 times |
Monthly price and charts EnergyEtf Strong monthly Stock price targets for EnergyEtf VDE are 118.54 and 125.9 | Monthly Target 1 | 116.52 | | Monthly Target 2 | 120.55 | | Monthly Target 3 | 123.87666666667 | | Monthly Target 4 | 127.91 | | Monthly Target 5 | 131.24 |
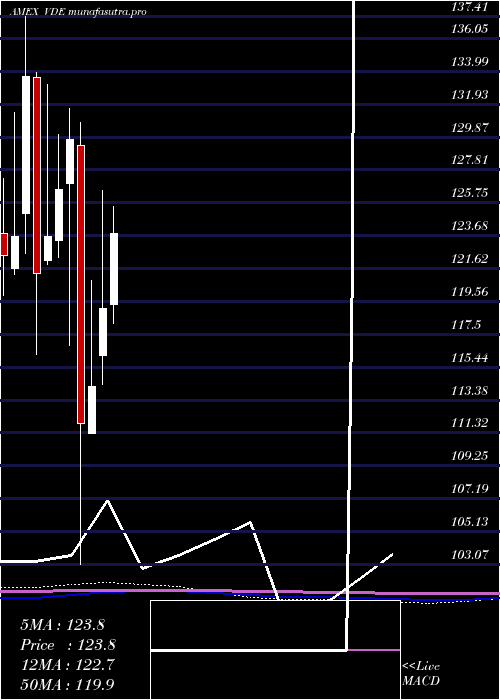
Monthly price and volumes Energy Etf
| Date |
Closing |
Open |
Range |
Volume |
Fri 24 October 2025 |
124.59 (-1.01%) |
125.28 |
119.84 - 127.20 |
0.5666 times |
Tue 30 September 2025 |
125.86 (-0.81%) |
126.42 |
121.68 - 130.92 |
1.0563 times |
Fri 29 August 2025 |
126.89 (3.63%) |
122.09 |
118.17 - 127.27 |
0.9049 times |
Thu 31 July 2025 |
122.45 (2.8%) |
119.37 |
118.17 - 125.51 |
0.7745 times |
Mon 30 June 2025 |
119.12 (4.3%) |
116.16 |
114.36 - 126.53 |
1.7789 times |
Fri 30 May 2025 |
114.21 (2.05%) |
111.26 |
111.26 - 120.88 |
0.8598 times |
Wed 30 April 2025 |
111.92 (-13.72%) |
129.37 |
103.07 - 130.79 |
1.5114 times |
Mon 31 March 2025 |
129.71 (2.46%) |
126.99 |
116.78 - 131.69 |
0.7014 times |
Fri 28 February 2025 |
126.60 (2.4%) |
123.40 |
122.33 - 130.05 |
0.6655 times |
Fri 31 January 2025 |
123.63 (1.91%) |
122.12 |
121.91 - 133.18 |
1.1807 times |
Tue 31 December 2024 |
121.31 (-9.24%) |
133.63 |
116.25 - 133.91 |
1.0306 times |
DMA SMA EMA moving averages of Energy Etf VDE
DMA (daily moving average) of Energy Etf VDE
| DMA period | DMA value | | 5 day DMA | 123.82 | | 12 day DMA | 122.69 | | 20 day DMA | 124.01 | | 35 day DMA | 124.79 | | 50 day DMA | 124.5 | | 100 day DMA | 122.74 | | 150 day DMA | 120.35 | | 200 day DMA | 121.83 | EMA (exponential moving average) of Energy Etf VDE
| EMA period | EMA current | EMA prev | EMA prev2 | | 5 day EMA | 124 | 123.71 | 122.69 | | 12 day EMA | 123.64 | 123.47 | 123.05 | | 20 day EMA | 123.86 | 123.78 | 123.57 | | 35 day EMA | 123.83 | 123.79 | 123.67 | | 50 day EMA | 124.04 | 124.02 | 123.95 |
SMA (simple moving average) of Energy Etf VDE
| SMA period | SMA current | SMA prev | SMA prev2 | | 5 day SMA | 123.82 | 123.17 | 122.15 | | 12 day SMA | 122.69 | 122.8 | 122.85 | | 20 day SMA | 124.01 | 124.26 | 124.4 | | 35 day SMA | 124.79 | 124.74 | 124.73 | | 50 day SMA | 124.5 | 124.41 | 124.3 | | 100 day SMA | 122.74 | 122.65 | 122.54 | | 150 day SMA | 120.35 | 120.38 | 120.4 | | 200 day SMA | 121.83 | 121.83 | 121.83 |
|
|
