VidentCore VBND full analysis,charts,indicators,moving averages,SMA,DMA,EMA,ADX,MACD,RSIVident Core VBND WideScreen charts, DMA,SMA,EMA technical analysis, forecast prediction, by indicators ADX,MACD,RSI,CCI AMEX stock exchange
Daily price and charts and targets VidentCore Strong Daily Stock price targets for VidentCore VBND are 44.51 and 44.97 | Daily Target 1 | 44.18 | | Daily Target 2 | 44.38 | | Daily Target 3 | 44.643333333333 | | Daily Target 4 | 44.84 | | Daily Target 5 | 45.1 |
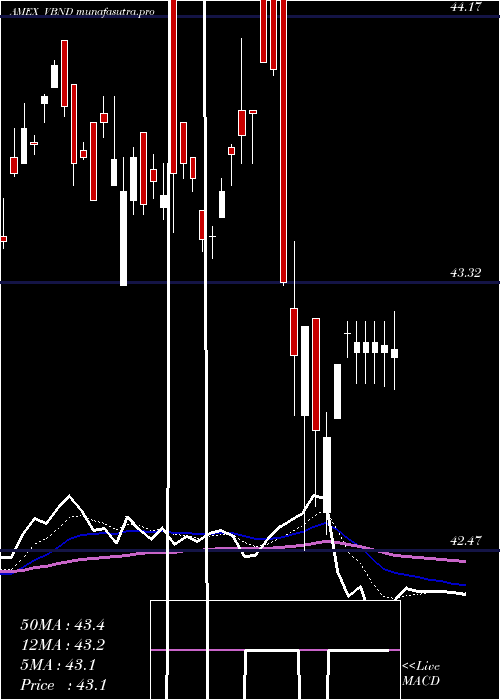
Daily price and volume Vident Core
| Date |
Closing |
Open |
Range |
Volume |
Thu 23 October 2025 |
44.57 (-0.2%) |
44.55 |
44.45 - 44.91 |
0.7362 times |
Wed 22 October 2025 |
44.66 (-0.09%) |
44.49 |
44.49 - 44.86 |
1.1757 times |
Tue 21 October 2025 |
44.70 (-0.49%) |
44.60 |
44.47 - 45.25 |
2.4027 times |
Mon 20 October 2025 |
44.92 (0.88%) |
44.32 |
44.32 - 44.95 |
0.269 times |
Fri 17 October 2025 |
44.53 (-0.25%) |
44.91 |
44.48 - 45.00 |
0.8161 times |
Thu 16 October 2025 |
44.64 (0.27%) |
44.50 |
44.45 - 44.90 |
0.7598 times |
Wed 15 October 2025 |
44.52 (0.16%) |
44.56 |
44.22 - 44.79 |
0.5901 times |
Tue 14 October 2025 |
44.45 (-0.09%) |
44.33 |
44.27 - 44.49 |
0.5199 times |
Mon 13 October 2025 |
44.49 (0.07%) |
44.18 |
44.03 - 45.24 |
1.5362 times |
Fri 10 October 2025 |
44.46 (0.5%) |
44.09 |
44.09 - 44.77 |
1.1943 times |
Thu 09 October 2025 |
44.24 (-0.18%) |
44.26 |
44.20 - 44.28 |
0.651 times |
Weekly price and charts VidentCore Strong weekly Stock price targets for VidentCore VBND are 44.45 and 45.38 | Weekly Target 1 | 43.78 | | Weekly Target 2 | 44.18 | | Weekly Target 3 | 44.713333333333 | | Weekly Target 4 | 45.11 | | Weekly Target 5 | 45.64 |
Weekly price and volumes for Vident Core
| Date |
Closing |
Open |
Range |
Volume |
Thu 23 October 2025 |
44.57 (0.09%) |
44.32 |
44.32 - 45.25 |
1.11 times |
Fri 17 October 2025 |
44.53 (0.16%) |
44.18 |
44.03 - 45.24 |
1.0224 times |
Fri 10 October 2025 |
44.46 (0.14%) |
44.35 |
44.09 - 44.77 |
0.8351 times |
Fri 03 October 2025 |
44.40 (0.75%) |
44.19 |
44.16 - 44.55 |
2.7271 times |
Fri 26 September 2025 |
44.07 (-0.43%) |
44.15 |
44.01 - 44.63 |
0.8631 times |
Fri 19 September 2025 |
44.26 (-0.36%) |
44.45 |
44.15 - 44.71 |
1.0616 times |
Fri 12 September 2025 |
44.42 (0.32%) |
44.07 |
44.07 - 44.83 |
0.668 times |
Fri 05 September 2025 |
44.28 (1%) |
43.67 |
43.65 - 44.33 |
0.6079 times |
Fri 29 August 2025 |
43.84 (0%) |
43.80 |
43.72 - 43.87 |
0.2439 times |
Fri 29 August 2025 |
43.84 (0.23%) |
43.75 |
43.39 - 43.91 |
0.8608 times |
Fri 22 August 2025 |
43.74 (0.05%) |
43.72 |
43.46 - 43.83 |
0.9992 times |

Monthly price and charts VidentCore Strong monthly Stock price targets for VidentCore VBND are 44.3 and 45.52 | Monthly Target 1 | 43.4 | | Monthly Target 2 | 43.98 | | Monthly Target 3 | 44.616666666667 | | Monthly Target 4 | 45.2 | | Monthly Target 5 | 45.84 |
Monthly price and volumes Vident Core
| Date |
Closing |
Open |
Range |
Volume |
Thu 23 October 2025 |
44.57 (0.7%) |
44.37 |
44.03 - 45.25 |
1.0332 times |
Tue 30 September 2025 |
44.26 (0.96%) |
43.67 |
43.65 - 44.83 |
0.6172 times |
Fri 29 August 2025 |
43.84 (0.92%) |
43.60 |
43.39 - 44.03 |
0.8933 times |
Thu 31 July 2025 |
43.44 (-0.39%) |
43.69 |
42.90 - 45.28 |
1.998 times |
Mon 30 June 2025 |
43.61 (1.16%) |
43.06 |
42.83 - 45.16 |
0.4402 times |
Fri 30 May 2025 |
43.11 (-1.1%) |
43.43 |
42.49 - 44.59 |
0.7165 times |
Wed 30 April 2025 |
43.59 (-0.32%) |
43.87 |
42.47 - 45.62 |
0.9978 times |
Mon 31 March 2025 |
43.73 (-0.41%) |
43.94 |
43.31 - 44.22 |
0.5507 times |
Fri 28 February 2025 |
43.91 (1.69%) |
43.26 |
42.92 - 43.92 |
1.0515 times |
Fri 31 January 2025 |
43.18 (0.51%) |
43.15 |
42.22 - 44.59 |
1.7015 times |
Tue 31 December 2024 |
42.96 (-1.65%) |
43.98 |
42.25 - 44.15 |
0.7148 times |

DMA SMA EMA moving averages of Vident Core VBND
DMA (daily moving average) of Vident Core VBND
| DMA period | DMA value | | 5 day DMA | 44.68 | | 12 day DMA | 44.54 | | 20 day DMA | 44.45 | | 35 day DMA | 44.41 | | 50 day DMA | 44.21 | | 100 day DMA | 43.83 | | 150 day DMA | 43.62 | | 200 day DMA | 43.55 | EMA (exponential moving average) of Vident Core VBND
| EMA period | EMA current | EMA prev | EMA prev2 | | 5 day EMA | 44.64 | 44.67 | 44.67 | | 12 day EMA | 44.57 | 44.57 | 44.55 | | 20 day EMA | 44.49 | 44.48 | 44.46 | | 35 day EMA | 44.35 | 44.34 | 44.32 | | 50 day EMA | 44.22 | 44.21 | 44.19 |
SMA (simple moving average) of Vident Core VBND
| SMA period | SMA current | SMA prev | SMA prev2 | | 5 day SMA | 44.68 | 44.69 | 44.66 | | 12 day SMA | 44.54 | 44.53 | 44.5 | | 20 day SMA | 44.45 | 44.43 | 44.41 | | 35 day SMA | 44.41 | 44.39 | 44.37 | | 50 day SMA | 44.21 | 44.2 | 44.18 | | 100 day SMA | 43.83 | 43.81 | 43.79 | | 150 day SMA | 43.62 | 43.62 | 43.61 | | 200 day SMA | 43.55 | 43.54 | 43.53 |
|
|
