SmallcapGrowth VBK full analysis,charts,indicators,moving averages,SMA,DMA,EMA,ADX,MACD,RSISmallcap Growth VBK WideScreen charts, DMA,SMA,EMA technical analysis, forecast prediction, by indicators ADX,MACD,RSI,CCI AMEX stock exchange
Daily price and charts and targets SmallcapGrowth Strong Daily Stock price targets for SmallcapGrowth VBK are 302.1 and 307.2 | Daily Target 1 | 297.96 | | Daily Target 2 | 301.14 | | Daily Target 3 | 303.05666666667 | | Daily Target 4 | 306.24 | | Daily Target 5 | 308.16 |
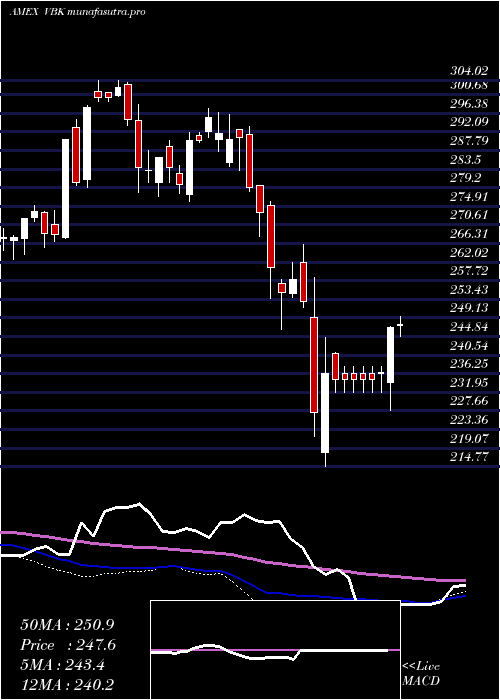
Daily price and volume Smallcap Growth
| Date |
Closing |
Open |
Range |
Volume |
Thu 23 October 2025 |
304.33 (1.78%) |
299.87 |
299.87 - 304.97 |
0.8035 times |
Wed 22 October 2025 |
299.01 (-1.96%) |
304.43 |
296.15 - 304.55 |
2.0262 times |
Tue 21 October 2025 |
304.99 (0.07%) |
304.08 |
302.67 - 306.50 |
0.9473 times |
Mon 20 October 2025 |
304.79 (1.55%) |
300.84 |
300.81 - 305.54 |
0.5169 times |
Fri 17 October 2025 |
300.14 (-0.46%) |
294.02 |
294.02 - 302.11 |
0.77 times |
Thu 16 October 2025 |
301.52 (-1.18%) |
305.60 |
299.89 - 307.23 |
1.0303 times |
Wed 15 October 2025 |
305.13 (0.68%) |
306.00 |
302.08 - 308.29 |
0.9254 times |
Tue 14 October 2025 |
303.06 (0.4%) |
297.74 |
296.49 - 305.56 |
0.9764 times |
Mon 13 October 2025 |
301.84 (2.42%) |
299.30 |
298.69 - 302.55 |
0.7426 times |
Fri 10 October 2025 |
294.70 (-3.05%) |
304.71 |
294.36 - 305.55 |
1.2613 times |
Thu 09 October 2025 |
303.96 (-0.53%) |
305.62 |
303.02 - 306.18 |
0.8585 times |

Weekly price and charts SmallcapGrowth Strong weekly Stock price targets for SmallcapGrowth VBK are 300.24 and 310.59 | Weekly Target 1 | 291.98 | | Weekly Target 2 | 298.15 | | Weekly Target 3 | 302.32666666667 | | Weekly Target 4 | 308.5 | | Weekly Target 5 | 312.68 |
Weekly price and volumes for Smallcap Growth
| Date |
Closing |
Open |
Range |
Volume |
Thu 23 October 2025 |
304.33 (1.4%) |
300.84 |
296.15 - 306.50 |
0.8865 times |
Fri 17 October 2025 |
300.14 (1.85%) |
299.30 |
294.02 - 308.29 |
0.9177 times |
Fri 10 October 2025 |
294.70 (-2.54%) |
303.22 |
294.36 - 306.76 |
1.0513 times |
Fri 03 October 2025 |
302.39 (1.41%) |
299.80 |
294.95 - 304.89 |
1.2292 times |
Fri 26 September 2025 |
298.19 (-1.85%) |
303.08 |
293.06 - 306.11 |
1.0106 times |
Fri 19 September 2025 |
303.82 (1.79%) |
299.38 |
297.67 - 305.82 |
1.2354 times |
Fri 12 September 2025 |
298.49 (0.44%) |
298.36 |
294.62 - 301.58 |
1.3079 times |
Fri 05 September 2025 |
297.17 (1.41%) |
289.02 |
287.97 - 299.00 |
0.8831 times |
Fri 29 August 2025 |
293.05 (0%) |
295.35 |
291.92 - 295.95 |
0.2657 times |
Fri 29 August 2025 |
293.05 (0.38%) |
291.42 |
289.30 - 295.95 |
1.2126 times |
Fri 22 August 2025 |
291.95 (1.97%) |
286.30 |
280.44 - 293.43 |
1.687 times |
Monthly price and charts SmallcapGrowth Strong monthly Stock price targets for SmallcapGrowth VBK are 299.18 and 313.45 | Monthly Target 1 | 287.94 | | Monthly Target 2 | 296.14 | | Monthly Target 3 | 302.21333333333 | | Monthly Target 4 | 310.41 | | Monthly Target 5 | 316.48 |
Monthly price and volumes Smallcap Growth
| Date |
Closing |
Open |
Range |
Volume |
Thu 23 October 2025 |
304.33 (2.25%) |
296.93 |
294.02 - 308.29 |
0.5301 times |
Tue 30 September 2025 |
297.62 (1.56%) |
289.02 |
287.97 - 306.11 |
0.7678 times |
Fri 29 August 2025 |
293.05 (3.77%) |
278.53 |
273.57 - 295.95 |
1.0141 times |
Thu 31 July 2025 |
282.39 (1.97%) |
275.52 |
274.50 - 288.46 |
0.9734 times |
Mon 30 June 2025 |
276.94 (4.97%) |
263.83 |
260.12 - 278.28 |
0.8071 times |
Fri 30 May 2025 |
263.82 (6.4%) |
250.01 |
248.13 - 271.49 |
0.8907 times |
Wed 30 April 2025 |
247.96 (-1.51%) |
251.27 |
214.77 - 258.46 |
1.4702 times |
Mon 31 March 2025 |
251.77 (-7.92%) |
275.17 |
245.59 - 275.98 |
1.5272 times |
Fri 28 February 2025 |
273.44 (-6.3%) |
285.10 |
268.04 - 296.10 |
0.8972 times |
Fri 31 January 2025 |
291.81 (4.2%) |
282.47 |
275.91 - 297.50 |
1.1222 times |
Tue 31 December 2024 |
280.06 (-6.63%) |
300.57 |
277.23 - 304.02 |
0.866 times |

DMA SMA EMA moving averages of Smallcap Growth VBK
DMA (daily moving average) of Smallcap Growth VBK
| DMA period | DMA value | | 5 day DMA | 302.65 | | 12 day DMA | 302.42 | | 20 day DMA | 301.58 | | 35 day DMA | 300.9 | | 50 day DMA | 297.58 | | 100 day DMA | 287.81 | | 150 day DMA | 275.23 | | 200 day DMA | 276.12 | EMA (exponential moving average) of Smallcap Growth VBK
| EMA period | EMA current | EMA prev | EMA prev2 | | 5 day EMA | 302.76 | 301.97 | 303.45 | | 12 day EMA | 302.32 | 301.95 | 302.48 | | 20 day EMA | 301.55 | 301.26 | 301.5 | | 35 day EMA | 299.19 | 298.89 | 298.88 | | 50 day EMA | 296.93 | 296.63 | 296.53 |
SMA (simple moving average) of Smallcap Growth VBK
| SMA period | SMA current | SMA prev | SMA prev2 | | 5 day SMA | 302.65 | 302.09 | 303.31 | | 12 day SMA | 302.42 | 302.17 | 302.63 | | 20 day SMA | 301.58 | 301.15 | 301.16 | | 35 day SMA | 300.9 | 300.6 | 300.37 | | 50 day SMA | 297.58 | 297.2 | 297.02 | | 100 day SMA | 287.81 | 287.4 | 287.06 | | 150 day SMA | 275.23 | 274.92 | 274.65 | | 200 day SMA | 276.12 | 276.02 | 275.94 |
|
|
