UltraFinancials UYG full analysis,charts,indicators,moving averages,SMA,DMA,EMA,ADX,MACD,RSIUltra Financials UYG WideScreen charts, DMA,SMA,EMA technical analysis, forecast prediction, by indicators ADX,MACD,RSI,CCI AMEX stock exchange
Daily price and charts and targets UltraFinancials Strong Daily Stock price targets for UltraFinancials UYG are 93.67 and 94.65 | Daily Target 1 | 92.86 | | Daily Target 2 | 93.49 | | Daily Target 3 | 93.843333333333 | | Daily Target 4 | 94.47 | | Daily Target 5 | 94.82 |
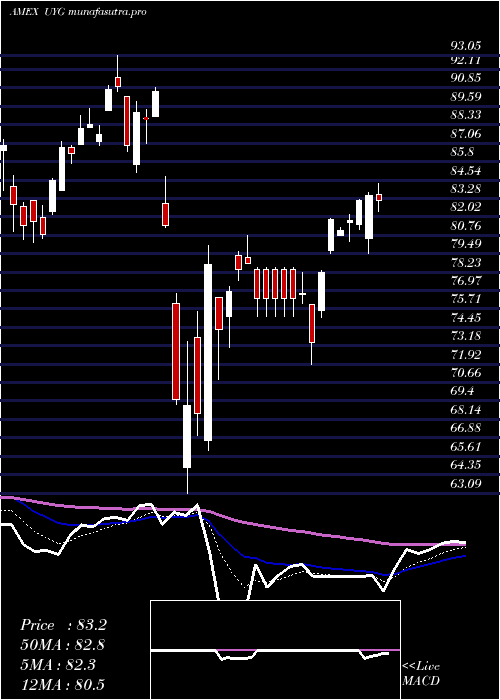
Daily price and volume Ultra Financials
| Date |
Closing |
Open |
Range |
Volume |
Thu 23 October 2025 |
94.11 (0.65%) |
93.67 |
93.22 - 94.20 |
0.2438 times |
Wed 22 October 2025 |
93.50 (-1.3%) |
94.02 |
92.39 - 94.09 |
0.3523 times |
Tue 21 October 2025 |
94.73 (-0.28%) |
94.60 |
94.60 - 95.61 |
0.2215 times |
Mon 20 October 2025 |
95.00 (2.43%) |
93.19 |
93.19 - 95.00 |
0.5372 times |
Fri 17 October 2025 |
92.75 (1.73%) |
91.88 |
91.28 - 93.08 |
0.8861 times |
Thu 16 October 2025 |
91.17 (-5.59%) |
95.90 |
90.47 - 95.90 |
1.5568 times |
Wed 15 October 2025 |
96.57 (-0.16%) |
97.85 |
95.62 - 98.19 |
2.3321 times |
Tue 14 October 2025 |
96.72 (2.14%) |
93.27 |
93.13 - 97.90 |
2.2213 times |
Mon 13 October 2025 |
94.69 (-4.03%) |
94.41 |
93.50 - 95.06 |
1.3722 times |
Tue 07 October 2025 |
98.67 (0.21%) |
99.15 |
98.46 - 99.64 |
0.2769 times |
Mon 06 October 2025 |
98.46 (-0.12%) |
99.20 |
97.27 - 99.20 |
0.5164 times |
Weekly price and charts UltraFinancials Strong weekly Stock price targets for UltraFinancials UYG are 93.25 and 96.47 | Weekly Target 1 | 90.82 | | Weekly Target 2 | 92.46 | | Weekly Target 3 | 94.036666666667 | | Weekly Target 4 | 95.68 | | Weekly Target 5 | 97.26 |
Weekly price and volumes for Ultra Financials
| Date |
Closing |
Open |
Range |
Volume |
Thu 23 October 2025 |
94.11 (1.47%) |
93.19 |
92.39 - 95.61 |
0.4539 times |
Fri 17 October 2025 |
92.75 (-6%) |
94.41 |
90.47 - 98.19 |
2.8038 times |
Tue 07 October 2025 |
98.67 (0.09%) |
99.20 |
97.27 - 99.64 |
0.2658 times |
Fri 03 October 2025 |
98.58 (-0.66%) |
99.69 |
96.40 - 100.34 |
1.007 times |
Fri 26 September 2025 |
99.23 (-1.13%) |
99.00 |
97.11 - 102.00 |
0.6432 times |
Fri 19 September 2025 |
100.36 (1.26%) |
100.00 |
97.01 - 101.44 |
1.1545 times |
Fri 12 September 2025 |
99.11 (2.75%) |
96.53 |
95.87 - 100.00 |
1.0267 times |
Fri 05 September 2025 |
96.46 (-3.44%) |
98.59 |
95.85 - 100.40 |
0.7277 times |
Fri 29 August 2025 |
99.90 (0%) |
99.88 |
99.30 - 100.49 |
0.4762 times |
Fri 29 August 2025 |
99.90 (1.3%) |
97.98 |
97.07 - 100.49 |
1.4411 times |
Fri 22 August 2025 |
98.62 (4.26%) |
94.49 |
94.21 - 99.00 |
0.8494 times |

Monthly price and charts UltraFinancials Strong monthly Stock price targets for UltraFinancials UYG are 87.71 and 96.88 | Monthly Target 1 | 85.57 | | Monthly Target 2 | 89.84 | | Monthly Target 3 | 94.74 | | Monthly Target 4 | 99.01 | | Monthly Target 5 | 103.91 |
Monthly price and volumes Ultra Financials
| Date |
Closing |
Open |
Range |
Volume |
Thu 23 October 2025 |
94.11 (-5.18%) |
98.46 |
90.47 - 99.64 |
0.5608 times |
Tue 30 September 2025 |
99.25 (-0.65%) |
98.59 |
95.85 - 102.00 |
0.5438 times |
Fri 29 August 2025 |
99.90 (5.62%) |
92.88 |
90.08 - 100.49 |
0.7779 times |
Thu 31 July 2025 |
94.58 (-1.02%) |
95.33 |
91.28 - 98.88 |
0.8313 times |
Mon 30 June 2025 |
95.55 (5.86%) |
88.79 |
86.28 - 95.58 |
0.7361 times |
Fri 30 May 2025 |
90.26 (8.11%) |
83.56 |
82.39 - 93.56 |
0.9504 times |
Wed 30 April 2025 |
83.49 (-6.36%) |
88.79 |
63.09 - 90.89 |
1.9031 times |
Mon 31 March 2025 |
89.16 (-9.26%) |
98.96 |
80.26 - 99.92 |
1.2719 times |
Fri 28 February 2025 |
98.26 (1.95%) |
93.48 |
91.52 - 99.00 |
1.0743 times |
Fri 31 January 2025 |
96.38 (12.78%) |
86.75 |
80.78 - 98.44 |
1.3503 times |
Tue 31 December 2024 |
85.46 (-10.9%) |
95.28 |
82.70 - 95.28 |
0.9192 times |

DMA SMA EMA moving averages of Ultra Financials UYG
DMA (daily moving average) of Ultra Financials UYG
| DMA period | DMA value | | 5 day DMA | 94.02 | | 12 day DMA | 95.41 | | 20 day DMA | 96.69 | | 35 day DMA | 97.56 | | 50 day DMA | 97.44 | | 100 day DMA | 95.25 | | 150 day DMA | 91.38 | | 200 day DMA | 91.46 | EMA (exponential moving average) of Ultra Financials UYG
| EMA period | EMA current | EMA prev | EMA prev2 | | 5 day EMA | 94.18 | 94.21 | 94.57 | | 12 day EMA | 95.16 | 95.35 | 95.69 | | 20 day EMA | 95.96 | 96.16 | 96.44 | | 35 day EMA | 96.37 | 96.5 | 96.68 | | 50 day EMA | 96.68 | 96.78 | 96.91 |
SMA (simple moving average) of Ultra Financials UYG
| SMA period | SMA current | SMA prev | SMA prev2 | | 5 day SMA | 94.02 | 93.43 | 94.04 | | 12 day SMA | 95.41 | 95.67 | 96.01 | | 20 day SMA | 96.69 | 97 | 97.34 | | 35 day SMA | 97.56 | 97.73 | 97.91 | | 50 day SMA | 97.44 | 97.4 | 97.38 | | 100 day SMA | 95.25 | 95.21 | 95.15 | | 150 day SMA | 91.38 | 91.33 | 91.27 | | 200 day SMA | 91.46 | 91.42 | 91.38 |
|
|
