UltraIndustrials UXI full analysis,charts,indicators,moving averages,SMA,DMA,EMA,ADX,MACD,RSIUltra Industrials UXI WideScreen charts, DMA,SMA,EMA technical analysis, forecast prediction, by indicators ADX,MACD,RSI,CCI AMEX stock exchange
Daily price and charts and targets UltraIndustrials Strong Daily Stock price targets for UltraIndustrials UXI are 46.22 and 46.74 | Daily Target 1 | 45.79 | | Daily Target 2 | 46.13 | | Daily Target 3 | 46.306666666667 | | Daily Target 4 | 46.65 | | Daily Target 5 | 46.83 |
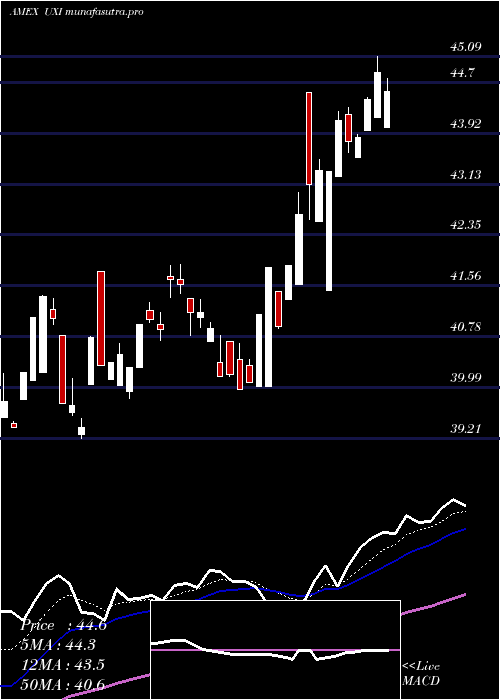
Daily price and volume Ultra Industrials
| Date |
Closing |
Open |
Range |
Volume |
Thu 23 October 2025 |
46.48 (2.27%) |
46.11 |
45.96 - 46.48 |
1.3007 times |
Wed 22 October 2025 |
45.45 (-2.66%) |
45.27 |
45.27 - 45.45 |
0.1237 times |
Tue 21 October 2025 |
46.69 (1.81%) |
46.36 |
46.25 - 46.96 |
2.1033 times |
Mon 20 October 2025 |
45.86 (2.39%) |
45.51 |
45.51 - 45.96 |
1.0129 times |
Fri 17 October 2025 |
44.79 (0.2%) |
44.50 |
44.42 - 44.93 |
0.9725 times |
Thu 16 October 2025 |
44.70 (-1.26%) |
45.02 |
44.45 - 45.06 |
0.899 times |
Wed 15 October 2025 |
45.27 (-0.98%) |
46.32 |
44.77 - 46.32 |
2.5569 times |
Tue 14 October 2025 |
45.72 (2.33%) |
45.08 |
45.08 - 45.91 |
0.2474 times |
Mon 13 October 2025 |
44.68 (2.03%) |
44.41 |
44.41 - 44.83 |
0.2062 times |
Fri 10 October 2025 |
43.79 (-4.41%) |
46.02 |
43.79 - 46.02 |
0.5774 times |
Thu 09 October 2025 |
45.81 (-2.99%) |
46.22 |
45.81 - 46.22 |
0.5361 times |
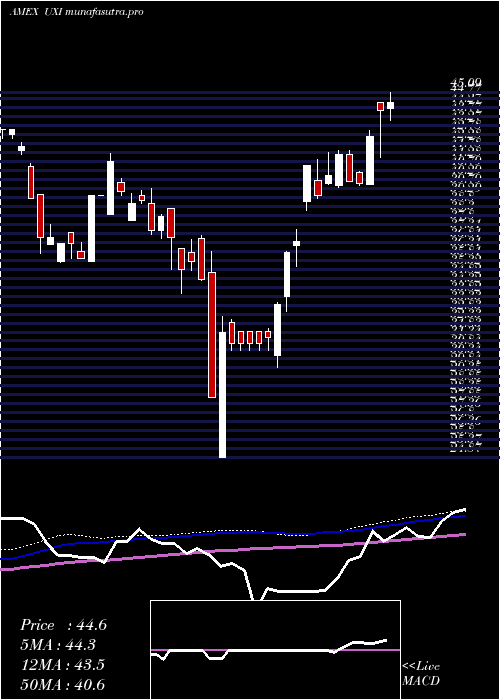
Weekly price and charts UltraIndustrials Strong weekly Stock price targets for UltraIndustrials UXI are 45.88 and 47.57 | Weekly Target 1 | 44.55 | | Weekly Target 2 | 45.51 | | Weekly Target 3 | 46.236666666667 | | Weekly Target 4 | 47.2 | | Weekly Target 5 | 47.93 |
Weekly price and volumes for Ultra Industrials
| Date |
Closing |
Open |
Range |
Volume |
Thu 23 October 2025 |
46.48 (3.77%) |
45.51 |
45.27 - 46.96 |
1.4507 times |
Fri 17 October 2025 |
44.79 (2.28%) |
44.41 |
44.41 - 46.32 |
1.5598 times |
Fri 10 October 2025 |
43.79 (-5.89%) |
46.93 |
43.79 - 47.22 |
0.671 times |
Fri 03 October 2025 |
46.53 (2.31%) |
45.46 |
44.97 - 47.00 |
0.6529 times |
Fri 26 September 2025 |
45.48 (-0.39%) |
45.18 |
44.61 - 46.42 |
0.5007 times |
Fri 19 September 2025 |
45.66 (1.92%) |
44.94 |
44.49 - 45.66 |
0.9355 times |
Fri 12 September 2025 |
44.80 (0.83%) |
43.90 |
43.50 - 45.57 |
1.5548 times |
Fri 05 September 2025 |
44.43 (-1.53%) |
43.71 |
43.48 - 44.79 |
0.8696 times |
Fri 29 August 2025 |
45.12 (0%) |
45.43 |
45.07 - 46.10 |
0.3953 times |
Fri 29 August 2025 |
45.12 (-1.64%) |
46.01 |
45.02 - 46.10 |
1.4098 times |
Fri 22 August 2025 |
45.87 (3.47%) |
44.55 |
44.09 - 46.21 |
2.6352 times |
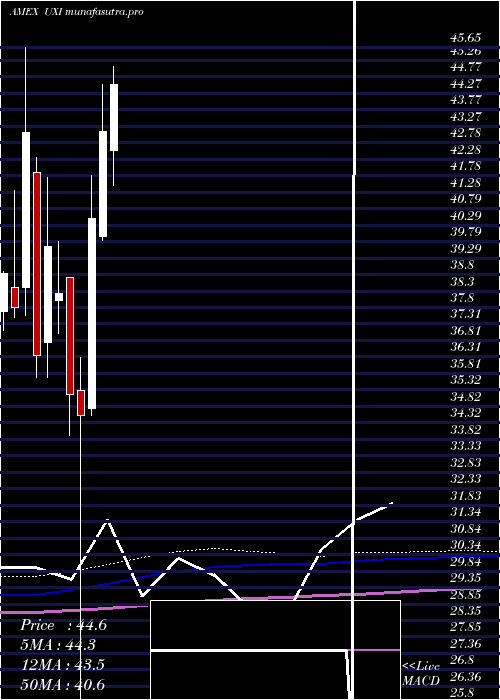
Monthly price and charts UltraIndustrials Strong monthly Stock price targets for UltraIndustrials UXI are 45.14 and 48.57 | Monthly Target 1 | 42.4 | | Monthly Target 2 | 44.44 | | Monthly Target 3 | 45.83 | | Monthly Target 4 | 47.87 | | Monthly Target 5 | 49.26 |
Monthly price and volumes Ultra Industrials
| Date |
Closing |
Open |
Range |
Volume |
Thu 23 October 2025 |
46.48 (0%) |
46.22 |
43.79 - 47.22 |
0.4478 times |
Tue 30 September 2025 |
46.48 (3.01%) |
43.71 |
43.48 - 46.48 |
0.445 times |
Fri 29 August 2025 |
45.12 (-0.57%) |
43.79 |
43.15 - 46.21 |
0.9933 times |
Thu 31 July 2025 |
45.38 (5.24%) |
42.55 |
41.49 - 47.53 |
1.0717 times |
Mon 30 June 2025 |
43.12 (6.47%) |
39.94 |
39.83 - 44.54 |
1.2876 times |
Fri 30 May 2025 |
40.50 (17.29%) |
34.74 |
34.54 - 41.79 |
1.4038 times |
Wed 30 April 2025 |
34.53 (-1.88%) |
35.29 |
24.87 - 36.30 |
0.9651 times |
Mon 31 March 2025 |
35.19 (-7.9%) |
38.70 |
33.95 - 38.70 |
0.9622 times |
Fri 28 February 2025 |
38.21 (-3.61%) |
38.02 |
37.01 - 39.79 |
0.7378 times |
Fri 31 January 2025 |
39.64 (9.05%) |
36.74 |
35.68 - 41.74 |
1.6858 times |
Tue 31 December 2024 |
36.35 (-15.62%) |
41.89 |
35.69 - 42.33 |
0.7205 times |
DMA SMA EMA moving averages of Ultra Industrials UXI
DMA (daily moving average) of Ultra Industrials UXI
| DMA period | DMA value | | 5 day DMA | 45.85 | | 12 day DMA | 45.54 | | 20 day DMA | 45.84 | | 35 day DMA | 45.5 | | 50 day DMA | 45.35 | | 100 day DMA | 44.43 | | 150 day DMA | 41.35 | | 200 day DMA | 40.54 | EMA (exponential moving average) of Ultra Industrials UXI
| EMA period | EMA current | EMA prev | EMA prev2 | | 5 day EMA | 45.93 | 45.66 | 45.76 | | 12 day EMA | 45.73 | 45.59 | 45.62 | | 20 day EMA | 45.67 | 45.59 | 45.6 | | 35 day EMA | 45.55 | 45.49 | 45.49 | | 50 day EMA | 45.38 | 45.33 | 45.32 |
SMA (simple moving average) of Ultra Industrials UXI
| SMA period | SMA current | SMA prev | SMA prev2 | | 5 day SMA | 45.85 | 45.5 | 45.46 | | 12 day SMA | 45.54 | 45.54 | 45.66 | | 20 day SMA | 45.84 | 45.75 | 45.74 | | 35 day SMA | 45.5 | 45.45 | 45.4 | | 50 day SMA | 45.35 | 45.32 | 45.32 | | 100 day SMA | 44.43 | 44.37 | 44.32 | | 150 day SMA | 41.35 | 41.28 | 41.22 | | 200 day SMA | 40.54 | 40.49 | 40.44 |
|
|
