UtilitiesBull UTSL full analysis,charts,indicators,moving averages,SMA,DMA,EMA,ADX,MACD,RSIUtilities Bull UTSL WideScreen charts, DMA,SMA,EMA technical analysis, forecast prediction, by indicators ADX,MACD,RSI,CCI AMEX stock exchange
Daily price and charts and targets UtilitiesBull Strong Daily Stock price targets for UtilitiesBull UTSL are 47.28 and 48.96 | Daily Target 1 | 46.89 | | Daily Target 2 | 47.67 | | Daily Target 3 | 48.573333333333 | | Daily Target 4 | 49.35 | | Daily Target 5 | 50.25 |
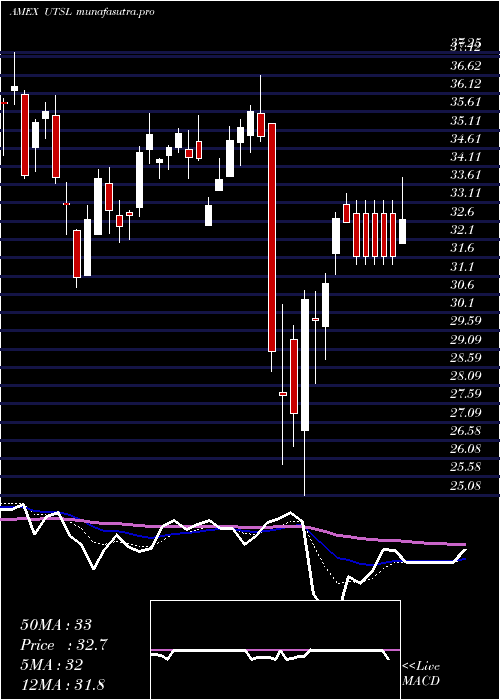
Daily price and volume Utilities Bull
| Date |
Closing |
Open |
Range |
Volume |
Thu 23 October 2025 |
48.44 (-0.35%) |
49.44 |
47.80 - 49.48 |
0.288 times |
Wed 22 October 2025 |
48.61 (-0.74%) |
49.41 |
47.93 - 49.41 |
0.4461 times |
Tue 21 October 2025 |
48.97 (-2.99%) |
50.73 |
48.25 - 50.73 |
0.7318 times |
Mon 20 October 2025 |
50.48 (-0.18%) |
51.78 |
49.94 - 52.12 |
0.5448 times |
Fri 17 October 2025 |
50.57 (-1.35%) |
51.37 |
49.93 - 51.45 |
1.1162 times |
Thu 16 October 2025 |
51.26 (-3.25%) |
53.46 |
51.14 - 54.25 |
1.4589 times |
Wed 15 October 2025 |
52.98 (4.17%) |
51.83 |
51.58 - 53.27 |
1.5531 times |
Tue 14 October 2025 |
50.86 (2.69%) |
49.14 |
49.09 - 51.33 |
1.5732 times |
Mon 13 October 2025 |
49.53 (2.14%) |
48.53 |
48.53 - 50.17 |
1.0066 times |
Tue 07 October 2025 |
48.49 (1.32%) |
48.35 |
48.10 - 49.13 |
1.2814 times |
Mon 06 October 2025 |
47.86 (2.77%) |
46.54 |
46.54 - 48.00 |
0.6603 times |
Weekly price and charts UtilitiesBull Strong weekly Stock price targets for UtilitiesBull UTSL are 45.96 and 50.28 | Weekly Target 1 | 45.13 | | Weekly Target 2 | 46.79 | | Weekly Target 3 | 49.453333333333 | | Weekly Target 4 | 51.11 | | Weekly Target 5 | 53.77 |
Weekly price and volumes for Utilities Bull
| Date |
Closing |
Open |
Range |
Volume |
Thu 23 October 2025 |
48.44 (-4.21%) |
51.78 |
47.80 - 52.12 |
0.4078 times |
Fri 17 October 2025 |
50.57 (4.29%) |
48.53 |
48.53 - 54.25 |
1.3603 times |
Tue 07 October 2025 |
48.49 (4.12%) |
46.54 |
46.54 - 49.13 |
0.3938 times |
Fri 03 October 2025 |
46.57 (7.3%) |
43.51 |
42.47 - 47.76 |
1.0987 times |
Fri 26 September 2025 |
43.40 (7.85%) |
40.22 |
39.97 - 43.46 |
1.433 times |
Fri 19 September 2025 |
40.24 (-2.12%) |
41.14 |
38.68 - 41.86 |
1.432 times |
Fri 12 September 2025 |
41.11 (6.92%) |
38.53 |
36.83 - 41.42 |
1.7436 times |
Fri 05 September 2025 |
38.45 (-3.29%) |
39.14 |
37.50 - 39.99 |
0.9812 times |
Fri 29 August 2025 |
39.76 (0%) |
40.32 |
39.50 - 40.32 |
0.1587 times |
Fri 29 August 2025 |
39.76 (-5.92%) |
41.84 |
39.50 - 41.97 |
0.9909 times |
Fri 22 August 2025 |
42.26 (1.1%) |
41.92 |
41.06 - 43.30 |
1.1249 times |

Monthly price and charts UtilitiesBull Strong monthly Stock price targets for UtilitiesBull UTSL are 46.24 and 56.46 | Monthly Target 1 | 38.69 | | Monthly Target 2 | 43.56 | | Monthly Target 3 | 48.906666666667 | | Monthly Target 4 | 53.78 | | Monthly Target 5 | 59.13 |
Monthly price and volumes Utilities Bull
| Date |
Closing |
Open |
Range |
Volume |
Thu 23 October 2025 |
48.44 (10.02%) |
44.29 |
44.03 - 54.25 |
0.3968 times |
Tue 30 September 2025 |
44.03 (10.74%) |
39.14 |
36.83 - 44.49 |
0.8829 times |
Fri 29 August 2025 |
39.76 (-5.78%) |
42.03 |
39.50 - 45.09 |
0.7533 times |
Thu 31 July 2025 |
42.20 (13.96%) |
37.00 |
35.10 - 42.77 |
1.2019 times |
Mon 30 June 2025 |
37.03 (-0.54%) |
36.79 |
34.23 - 38.82 |
0.6919 times |
Fri 30 May 2025 |
37.23 (10.08%) |
34.41 |
32.65 - 39.11 |
1.2299 times |
Wed 30 April 2025 |
33.82 (-2.9%) |
34.76 |
25.08 - 36.60 |
1.0449 times |
Mon 31 March 2025 |
34.83 (-1.42%) |
35.43 |
30.77 - 36.07 |
0.7322 times |
Fri 28 February 2025 |
35.33 (3.79%) |
32.54 |
32.48 - 37.39 |
0.898 times |
Fri 31 January 2025 |
34.04 (6.38%) |
32.54 |
29.59 - 37.90 |
2.1682 times |
Tue 31 December 2024 |
32.00 (-23.54%) |
39.84 |
30.27 - 40.08 |
1.0106 times |

DMA SMA EMA moving averages of Utilities Bull UTSL
DMA (daily moving average) of Utilities Bull UTSL
| DMA period | DMA value | | 5 day DMA | 49.41 | | 12 day DMA | 49.55 | | 20 day DMA | 47.11 | | 35 day DMA | 43.87 | | 50 day DMA | 43.16 | | 100 day DMA | 40.64 | | 150 day DMA | 38.34 | | 200 day DMA | 37.35 | EMA (exponential moving average) of Utilities Bull UTSL
| EMA period | EMA current | EMA prev | EMA prev2 | | 5 day EMA | 49.17 | 49.54 | 50 | | 12 day EMA | 48.68 | 48.72 | 48.74 | | 20 day EMA | 47.37 | 47.26 | 47.12 | | 35 day EMA | 45.71 | 45.55 | 45.37 | | 50 day EMA | 43.73 | 43.54 | 43.33 |
SMA (simple moving average) of Utilities Bull UTSL
| SMA period | SMA current | SMA prev | SMA prev2 | | 5 day SMA | 49.41 | 49.98 | 50.85 | | 12 day SMA | 49.55 | 49.27 | 49 | | 20 day SMA | 47.11 | 46.76 | 46.34 | | 35 day SMA | 43.87 | 43.62 | 43.37 | | 50 day SMA | 43.16 | 43.04 | 42.92 | | 100 day SMA | 40.64 | 40.52 | 40.4 | | 150 day SMA | 38.34 | 38.26 | 38.16 | | 200 day SMA | 37.35 | 37.28 | 37.2 |
|
|
