UsReit USRT full analysis,charts,indicators,moving averages,SMA,DMA,EMA,ADX,MACD,RSIUs Reit USRT WideScreen charts, DMA,SMA,EMA technical analysis, forecast prediction, by indicators ADX,MACD,RSI,CCI AMEX stock exchange
Daily price and charts and targets UsReit Strong Daily Stock price targets for UsReit USRT are 58.69 and 59.36 | Daily Target 1 | 58.51 | | Daily Target 2 | 58.87 | | Daily Target 3 | 59.183333333333 | | Daily Target 4 | 59.54 | | Daily Target 5 | 59.85 |
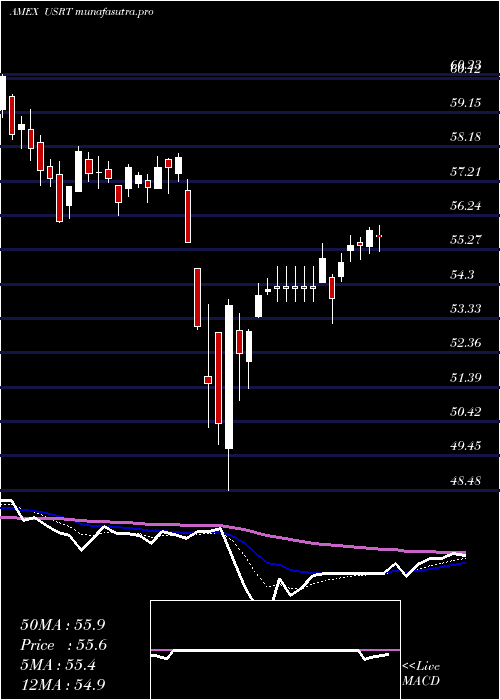
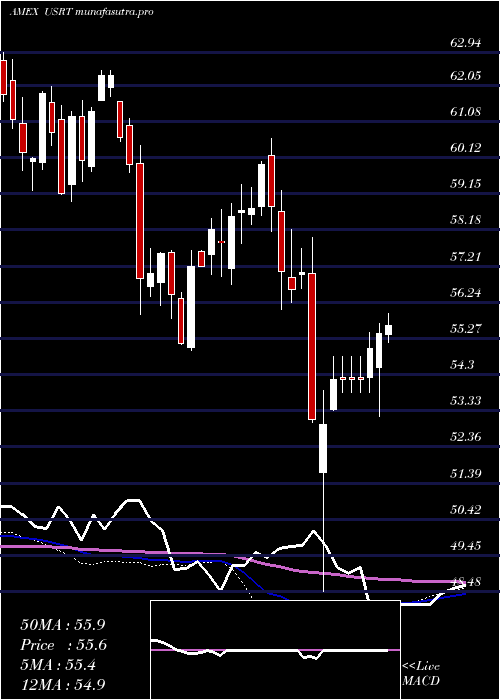
Daily price and volume Us Reit
| Date |
Closing |
Open |
Range |
Volume |
Thu 23 October 2025 |
59.22 (-0.2%) |
59.46 |
58.83 - 59.50 |
1.1796 times |
Wed 22 October 2025 |
59.34 (0.54%) |
59.20 |
58.99 - 59.41 |
0.8865 times |
Tue 21 October 2025 |
59.02 (-0.47%) |
59.31 |
58.96 - 59.43 |
0.9089 times |
Mon 20 October 2025 |
59.30 (0.87%) |
59.01 |
58.89 - 59.31 |
0.9714 times |
Fri 17 October 2025 |
58.79 (0.89%) |
58.35 |
58.18 - 58.83 |
1.5658 times |
Thu 16 October 2025 |
58.27 (-0.43%) |
58.58 |
58.11 - 58.76 |
0.8091 times |
Wed 15 October 2025 |
58.52 (0.74%) |
57.93 |
57.93 - 58.75 |
0.5113 times |
Tue 07 October 2025 |
58.09 (-0.43%) |
58.41 |
57.86 - 58.41 |
1.1769 times |
Mon 06 October 2025 |
58.34 (-0.75%) |
58.73 |
58.28 - 58.82 |
0.8809 times |
Fri 03 October 2025 |
58.78 (0.46%) |
58.52 |
58.52 - 59.17 |
1.1097 times |
Thu 02 October 2025 |
58.51 (-0.53%) |
58.67 |
58.13 - 58.67 |
1.0675 times |
Weekly price and charts UsReit Strong weekly Stock price targets for UsReit USRT are 59.03 and 59.7 | Weekly Target 1 | 58.51 | | Weekly Target 2 | 58.87 | | Weekly Target 3 | 59.183333333333 | | Weekly Target 4 | 59.54 | | Weekly Target 5 | 59.85 |
Weekly price and volumes for Us Reit
| Date |
Closing |
Open |
Range |
Volume |
Thu 23 October 2025 |
59.22 (0.73%) |
59.01 |
58.83 - 59.50 |
0.7389 times |
Fri 17 October 2025 |
58.79 (0.02%) |
58.73 |
57.86 - 58.83 |
0.9257 times |
Fri 03 October 2025 |
58.78 (0.89%) |
58.34 |
58.09 - 59.17 |
0.9174 times |
Fri 26 September 2025 |
58.26 (0.69%) |
57.89 |
57.47 - 58.58 |
1.4184 times |
Fri 19 September 2025 |
57.86 (-2.2%) |
59.38 |
57.86 - 59.38 |
1.3467 times |
Fri 12 September 2025 |
59.16 (0.54%) |
58.44 |
58.21 - 59.44 |
1.3099 times |
Fri 05 September 2025 |
58.84 (0.51%) |
58.08 |
57.40 - 59.12 |
1.2878 times |
Fri 29 August 2025 |
58.54 (0%) |
58.23 |
58.23 - 58.57 |
0.158 times |
Fri 29 August 2025 |
58.54 (0.97%) |
57.95 |
57.53 - 58.57 |
0.8096 times |
Fri 22 August 2025 |
57.98 (2.76%) |
56.48 |
55.98 - 58.37 |
1.0876 times |
Fri 15 August 2025 |
56.42 (0.82%) |
55.81 |
55.44 - 56.70 |
0.9927 times |
Monthly price and charts UsReit Strong monthly Stock price targets for UsReit USRT are 58.54 and 60.18 | Monthly Target 1 | 57.22 | | Monthly Target 2 | 58.22 | | Monthly Target 3 | 58.86 | | Monthly Target 4 | 59.86 | | Monthly Target 5 | 60.5 |
Monthly price and volumes Us Reit
| Date |
Closing |
Open |
Range |
Volume |
Thu 23 October 2025 |
59.22 (0.85%) |
58.52 |
57.86 - 59.50 |
0.4018 times |
Tue 30 September 2025 |
58.72 (0.31%) |
58.08 |
57.40 - 59.44 |
1.0012 times |
Fri 29 August 2025 |
58.54 (4.52%) |
56.26 |
55.34 - 58.57 |
0.7548 times |
Thu 31 July 2025 |
56.01 (-0.97%) |
56.45 |
55.98 - 58.07 |
0.7922 times |
Mon 30 June 2025 |
56.56 (-1.1%) |
56.99 |
55.39 - 58.24 |
0.8081 times |
Fri 30 May 2025 |
57.19 (2.23%) |
56.21 |
55.13 - 57.72 |
0.9014 times |
Wed 30 April 2025 |
55.94 (-2.88%) |
57.82 |
48.48 - 57.98 |
1.3035 times |
Mon 31 March 2025 |
57.60 (-3.89%) |
60.18 |
56.05 - 60.63 |
1.413 times |
Fri 28 February 2025 |
59.93 (3.61%) |
57.15 |
56.72 - 60.02 |
0.8432 times |
Fri 31 January 2025 |
57.84 (0.92%) |
57.30 |
54.95 - 58.71 |
1.7809 times |
Tue 31 December 2024 |
57.31 (-8.04%) |
61.63 |
55.90 - 61.63 |
1.208 times |

DMA SMA EMA moving averages of Us Reit USRT
DMA (daily moving average) of Us Reit USRT
| DMA period | DMA value | | 5 day DMA | 59.13 | | 12 day DMA | 58.75 | | 20 day DMA | 58.51 | | 35 day DMA | 58.5 | | 50 day DMA | 58.03 | | 100 day DMA | 57.49 | | 150 day DMA | 56.9 | | 200 day DMA | 57.18 | EMA (exponential moving average) of Us Reit USRT
| EMA period | EMA current | EMA prev | EMA prev2 | | 5 day EMA | 59.08 | 59.01 | 58.85 | | 12 day EMA | 58.81 | 58.74 | 58.63 | | 20 day EMA | 58.64 | 58.58 | 58.5 | | 35 day EMA | 58.28 | 58.22 | 58.15 | | 50 day EMA | 58 | 57.95 | 57.89 |
SMA (simple moving average) of Us Reit USRT
| SMA period | SMA current | SMA prev | SMA prev2 | | 5 day SMA | 59.13 | 58.94 | 58.78 | | 12 day SMA | 58.75 | 58.71 | 58.62 | | 20 day SMA | 58.51 | 58.46 | 58.39 | | 35 day SMA | 58.5 | 58.47 | 58.44 | | 50 day SMA | 58.03 | 57.97 | 57.91 | | 100 day SMA | 57.49 | 57.45 | 57.42 | | 150 day SMA | 56.9 | 56.88 | 56.86 | | 200 day SMA | 57.18 | 57.17 | 57.16 |
|
|
