UsOil USO full analysis,charts,indicators,moving averages,SMA,DMA,EMA,ADX,MACD,RSIUs Oil USO WideScreen charts, DMA,SMA,EMA technical analysis, forecast prediction, by indicators ADX,MACD,RSI,CCI AMEX stock exchange
Daily price and charts and targets UsOil Strong Daily Stock price targets for UsOil USO are 72.5 and 74.82 | Daily Target 1 | 70.67 | | Daily Target 2 | 72 | | Daily Target 3 | 72.993333333333 | | Daily Target 4 | 74.32 | | Daily Target 5 | 75.31 |
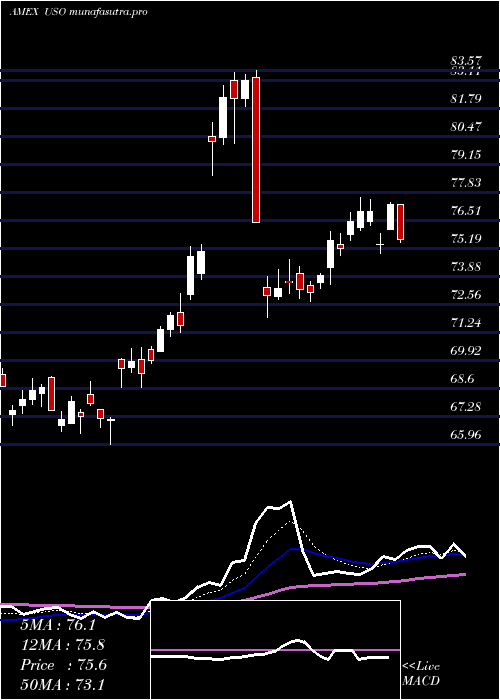
Daily price and volume Us Oil
| Date |
Closing |
Open |
Range |
Volume |
Thu 23 October 2025 |
73.32 (3.76%) |
71.67 |
71.67 - 73.99 |
1.0659 times |
Wed 22 October 2025 |
70.66 (3.5%) |
69.52 |
69.33 - 71.18 |
1.8218 times |
Tue 21 October 2025 |
68.27 (0.69%) |
68.05 |
67.04 - 69.14 |
1.6101 times |
Mon 20 October 2025 |
67.80 (-0.26%) |
67.53 |
66.59 - 67.90 |
0.7595 times |
Fri 17 October 2025 |
67.98 (0.25%) |
67.43 |
66.80 - 68.16 |
0.648 times |
Thu 16 October 2025 |
67.81 (-1.71%) |
69.61 |
67.53 - 69.64 |
0.8974 times |
Wed 15 October 2025 |
68.99 (-0.01%) |
69.71 |
68.71 - 69.86 |
0.6053 times |
Tue 14 October 2025 |
69.00 (-1.82%) |
69.15 |
68.51 - 69.60 |
0.7597 times |
Mon 13 October 2025 |
70.28 (1.28%) |
70.31 |
69.90 - 70.89 |
0.599 times |
Fri 10 October 2025 |
69.39 (-4.3%) |
70.77 |
69.30 - 71.37 |
1.2333 times |
Thu 09 October 2025 |
72.51 (-1.39%) |
73.81 |
72.24 - 73.91 |
0.6948 times |
Weekly price and charts UsOil Strong weekly Stock price targets for UsOil USO are 69.96 and 77.36 | Weekly Target 1 | 63.9 | | Weekly Target 2 | 68.61 | | Weekly Target 3 | 71.3 | | Weekly Target 4 | 76.01 | | Weekly Target 5 | 78.7 |
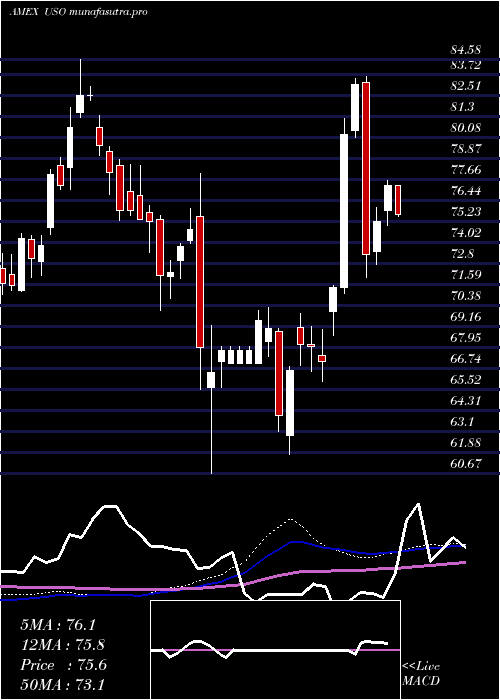
Weekly price and volumes for Us Oil
| Date |
Closing |
Open |
Range |
Volume |
Thu 23 October 2025 |
73.32 (7.86%) |
67.53 |
66.59 - 73.99 |
1.5376 times |
Fri 17 October 2025 |
67.98 (-2.03%) |
70.31 |
66.80 - 70.89 |
1.0264 times |
Fri 10 October 2025 |
69.39 (-3.24%) |
72.71 |
69.30 - 74.13 |
1.1732 times |
Fri 03 October 2025 |
71.71 (-6.89%) |
75.43 |
71.28 - 75.50 |
1.4019 times |
Fri 26 September 2025 |
77.02 (4.76%) |
72.80 |
72.72 - 78.32 |
1.0439 times |
Fri 19 September 2025 |
73.52 (0.29%) |
74.26 |
73.33 - 75.86 |
1.0093 times |
Fri 12 September 2025 |
73.31 (0.94%) |
73.49 |
72.57 - 75.05 |
1.0037 times |
Fri 05 September 2025 |
72.63 (-2.95%) |
76.08 |
71.96 - 76.96 |
0.9247 times |
Fri 29 August 2025 |
74.84 (0%) |
75.35 |
74.74 - 75.45 |
0.1527 times |
Fri 29 August 2025 |
74.84 (0.27%) |
75.19 |
73.85 - 76.12 |
0.7265 times |
Fri 22 August 2025 |
74.64 (2.53%) |
72.35 |
71.81 - 74.73 |
0.8957 times |
Monthly price and charts UsOil Strong monthly Stock price targets for UsOil USO are 69.96 and 77.5 | Monthly Target 1 | 63.81 | | Monthly Target 2 | 68.56 | | Monthly Target 3 | 71.346666666667 | | Monthly Target 4 | 76.1 | | Monthly Target 5 | 78.89 |
Monthly price and volumes Us Oil
| Date |
Closing |
Open |
Range |
Volume |
Thu 23 October 2025 |
73.32 (-0.58%) |
72.65 |
66.59 - 74.13 |
0.9652 times |
Tue 30 September 2025 |
73.75 (-1.46%) |
76.08 |
71.96 - 78.32 |
0.9791 times |
Fri 29 August 2025 |
74.84 (-5.97%) |
79.71 |
71.56 - 79.83 |
0.8954 times |
Thu 31 July 2025 |
79.59 (8.86%) |
73.61 |
73.32 - 81.13 |
1.0509 times |
Mon 30 June 2025 |
73.11 (8.88%) |
69.99 |
68.64 - 83.57 |
2.504 times |
Fri 30 May 2025 |
67.15 (5.65%) |
63.59 |
61.75 - 69.88 |
0.9901 times |
Wed 30 April 2025 |
63.56 (-17.81%) |
77.60 |
60.67 - 78.01 |
1.0329 times |
Mon 31 March 2025 |
77.33 (2.81%) |
75.33 |
70.09 - 77.72 |
0.4681 times |
Fri 28 February 2025 |
75.22 (-3.59%) |
78.42 |
73.41 - 78.77 |
0.4882 times |
Fri 31 January 2025 |
78.02 (3.27%) |
76.84 |
76.76 - 84.58 |
0.6261 times |
Tue 31 December 2024 |
75.55 (5.5%) |
72.16 |
71.16 - 75.75 |
0.325 times |
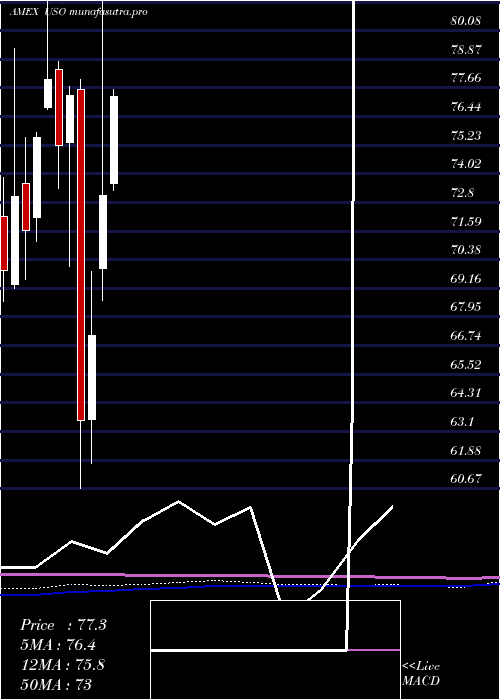
DMA SMA EMA moving averages of Us Oil USO
DMA (daily moving average) of Us Oil USO
| DMA period | DMA value | | 5 day DMA | 69.61 | | 12 day DMA | 69.96 | | 20 day DMA | 71.37 | | 35 day DMA | 72.64 | | 50 day DMA | 73.16 | | 100 day DMA | 74.19 | | 150 day DMA | 72.23 | | 200 day DMA | 73.3 | EMA (exponential moving average) of Us Oil USO
| EMA period | EMA current | EMA prev | EMA prev2 | | 5 day EMA | 70.55 | 69.17 | 68.42 | | 12 day EMA | 70.43 | 69.9 | 69.76 | | 20 day EMA | 71.08 | 70.84 | 70.86 | | 35 day EMA | 71.91 | 71.83 | 71.9 | | 50 day EMA | 72.83 | 72.81 | 72.9 |
SMA (simple moving average) of Us Oil USO
| SMA period | SMA current | SMA prev | SMA prev2 | | 5 day SMA | 69.61 | 68.5 | 68.17 | | 12 day SMA | 69.96 | 69.95 | 70.14 | | 20 day SMA | 71.37 | 71.55 | 71.84 | | 35 day SMA | 72.64 | 72.66 | 72.78 | | 50 day SMA | 73.16 | 73.17 | 73.21 | | 100 day SMA | 74.19 | 74.13 | 74.09 | | 150 day SMA | 72.23 | 72.24 | 72.25 | | 200 day SMA | 73.3 | 73.32 | 73.36 |
|
|
