UltraSemiconductors USD full analysis,charts,indicators,moving averages,SMA,DMA,EMA,ADX,MACD,RSIUltra Semiconductors USD WideScreen charts, DMA,SMA,EMA technical analysis, forecast prediction, by indicators ADX,MACD,RSI,CCI AMEX stock exchange
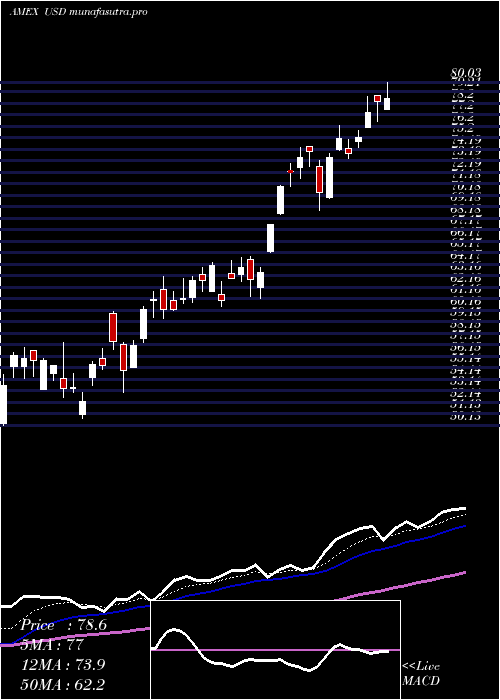
Daily price and charts and targets UltraSemiconductors Strong Daily Stock price targets for UltraSemiconductors USD are 100.39 and 105.66 | Daily Target 1 | 96.11 | | Daily Target 2 | 99.4 | | Daily Target 3 | 101.38333333333 | | Daily Target 4 | 104.67 | | Daily Target 5 | 106.65 |
Daily price and volume Ultra Semiconductors
| Date |
Closing |
Open |
Range |
Volume |
Thu 23 October 2025 |
102.68 (3%) |
99.75 |
98.10 - 103.37 |
0.4841 times |
Wed 22 October 2025 |
99.69 (-2.32%) |
101.77 |
95.93 - 103.21 |
1.0073 times |
Tue 21 October 2025 |
102.06 (-1.71%) |
103.79 |
100.61 - 103.80 |
0.7017 times |
Mon 20 October 2025 |
103.84 (0.66%) |
104.00 |
103.61 - 106.02 |
0.4545 times |
Fri 17 October 2025 |
103.16 (0.17%) |
100.85 |
99.38 - 103.82 |
0.9209 times |
Thu 16 October 2025 |
102.99 (1.71%) |
103.63 |
100.80 - 105.40 |
1.3156 times |
Wed 15 October 2025 |
101.26 (2.7%) |
103.95 |
98.16 - 103.95 |
1.2608 times |
Tue 14 October 2025 |
98.60 (-6.73%) |
101.83 |
97.71 - 102.68 |
1.4735 times |
Mon 13 October 2025 |
105.72 (3.76%) |
104.66 |
103.37 - 106.87 |
1.3256 times |
Tue 07 October 2025 |
101.89 (-1.36%) |
104.56 |
100.51 - 105.87 |
1.0561 times |
Mon 06 October 2025 |
103.30 (0.71%) |
103.80 |
100.83 - 105.83 |
0.6199 times |
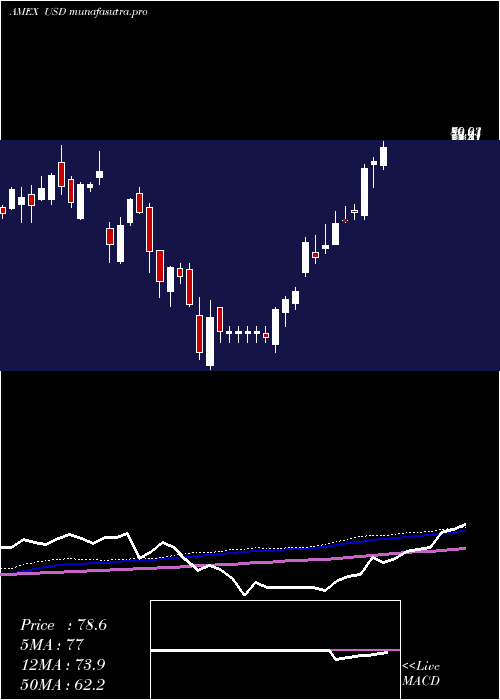
Weekly price and charts UltraSemiconductors Strong weekly Stock price targets for UltraSemiconductors USD are 94.26 and 104.35 | Weekly Target 1 | 91.45 | | Weekly Target 2 | 97.07 | | Weekly Target 3 | 101.54333333333 | | Weekly Target 4 | 107.16 | | Weekly Target 5 | 111.63 |
Weekly price and volumes for Ultra Semiconductors
| Date |
Closing |
Open |
Range |
Volume |
Thu 23 October 2025 |
102.68 (-0.47%) |
104.00 |
95.93 - 106.02 |
0.5989 times |
Fri 17 October 2025 |
103.16 (1.25%) |
104.66 |
97.71 - 106.87 |
1.4243 times |
Tue 07 October 2025 |
101.89 (-0.66%) |
103.80 |
100.51 - 105.87 |
0.3791 times |
Fri 03 October 2025 |
102.57 (8.65%) |
96.19 |
95.30 - 105.62 |
1.0827 times |
Fri 26 September 2025 |
94.40 (0.73%) |
93.05 |
89.51 - 98.76 |
1.1309 times |
Fri 19 September 2025 |
93.72 (-0.34%) |
92.86 |
86.90 - 94.94 |
1.2092 times |
Fri 12 September 2025 |
94.04 (12.07%) |
85.23 |
84.36 - 96.37 |
1.3638 times |
Fri 05 September 2025 |
83.91 (-0.55%) |
79.89 |
78.88 - 86.70 |
1.0282 times |
Fri 29 August 2025 |
84.37 (0%) |
88.01 |
83.12 - 88.12 |
0.3603 times |
Fri 29 August 2025 |
84.37 (-2.63%) |
86.79 |
83.12 - 92.37 |
1.4225 times |
Fri 22 August 2025 |
86.65 (-3.23%) |
88.98 |
78.71 - 90.64 |
1.4349 times |
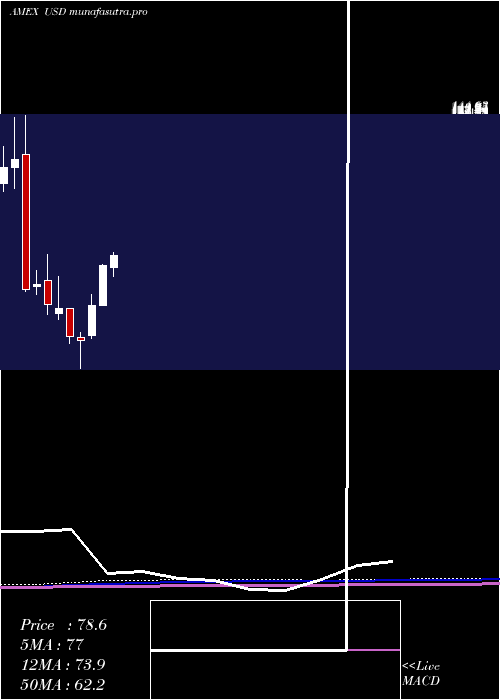
Monthly price and charts UltraSemiconductors Strong monthly Stock price targets for UltraSemiconductors USD are 99.31 and 110.25 | Monthly Target 1 | 90.89 | | Monthly Target 2 | 96.78 | | Monthly Target 3 | 101.82666666667 | | Monthly Target 4 | 107.72 | | Monthly Target 5 | 112.77 |
Monthly price and volumes Ultra Semiconductors
| Date |
Closing |
Open |
Range |
Volume |
Thu 23 October 2025 |
102.68 (3.7%) |
97.97 |
95.93 - 106.87 |
0.3868 times |
Tue 30 September 2025 |
99.02 (17.36%) |
79.89 |
78.88 - 99.29 |
0.6982 times |
Fri 29 August 2025 |
84.37 (-1.62%) |
81.80 |
78.71 - 93.82 |
0.8093 times |
Thu 31 July 2025 |
85.76 (15.89%) |
72.73 |
68.86 - 90.57 |
0.8502 times |
Mon 30 June 2025 |
74.00 (34.74%) |
55.19 |
55.17 - 74.47 |
0.8612 times |
Fri 30 May 2025 |
54.92 (42.24%) |
40.81 |
39.54 - 60.06 |
1.2 times |
Wed 30 April 2025 |
38.61 (-4.34%) |
40.04 |
25.13 - 42.49 |
1.5777 times |
Mon 31 March 2025 |
40.36 (-24.6%) |
53.69 |
37.00 - 53.69 |
1.0504 times |
Fri 28 February 2025 |
53.53 (-3.18%) |
51.24 |
48.44 - 68.90 |
0.9776 times |
Fri 31 January 2025 |
55.29 (-15.12%) |
66.87 |
50.88 - 79.10 |
1.5885 times |
Tue 31 December 2024 |
65.14 (4.04%) |
63.88 |
60.43 - 71.68 |
1.0626 times |
DMA SMA EMA moving averages of Ultra Semiconductors USD
DMA (daily moving average) of Ultra Semiconductors USD
| DMA period | DMA value | | 5 day DMA | 102.29 | | 12 day DMA | 102.31 | | 20 day DMA | 100.27 | | 35 day DMA | 95.79 | | 50 day DMA | 93.49 | | 100 day DMA | 83.56 | | 150 day DMA | 69.73 | | 200 day DMA | 67.06 | EMA (exponential moving average) of Ultra Semiconductors USD
| EMA period | EMA current | EMA prev | EMA prev2 | | 5 day EMA | 101.97 | 101.62 | 102.59 | | 12 day EMA | 101.43 | 101.2 | 101.48 | | 20 day EMA | 99.97 | 99.68 | 99.68 | | 35 day EMA | 97.12 | 96.79 | 96.62 | | 50 day EMA | 93.91 | 93.55 | 93.3 |
SMA (simple moving average) of Ultra Semiconductors USD
| SMA period | SMA current | SMA prev | SMA prev2 | | 5 day SMA | 102.29 | 102.35 | 102.66 | | 12 day SMA | 102.31 | 102.42 | 102.55 | | 20 day SMA | 100.27 | 100.03 | 99.73 | | 35 day SMA | 95.79 | 95.27 | 94.83 | | 50 day SMA | 93.49 | 93.22 | 93.03 | | 100 day SMA | 83.56 | 83.09 | 82.61 | | 150 day SMA | 69.73 | 69.35 | 69.02 | | 200 day SMA | 67.06 | 66.93 | 66.79 |
|
|
