AmericanEnergy USAI full analysis,charts,indicators,moving averages,SMA,DMA,EMA,ADX,MACD,RSIAmerican Energy USAI WideScreen charts, DMA,SMA,EMA technical analysis, forecast prediction, by indicators ADX,MACD,RSI,CCI AMEX stock exchange
Daily price and charts and targets AmericanEnergy Strong Daily Stock price targets for AmericanEnergy USAI are 37.09 and 37.79 | Daily Target 1 | 36.97 | | Daily Target 2 | 37.21 | | Daily Target 3 | 37.673333333333 | | Daily Target 4 | 37.91 | | Daily Target 5 | 38.37 |
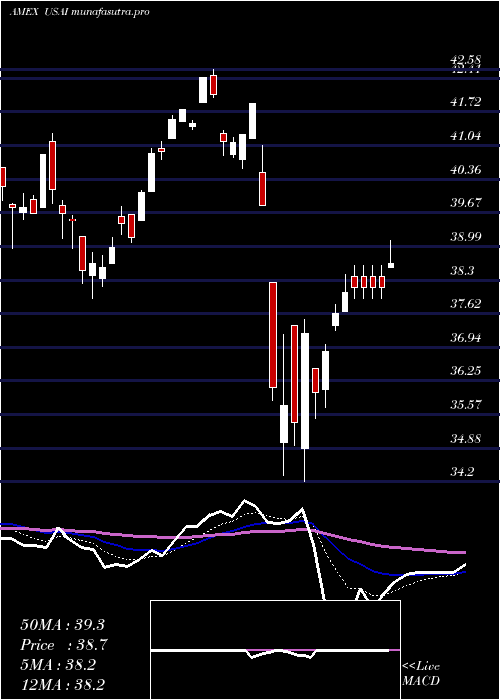
Daily price and volume American Energy
| Date |
Closing |
Open |
Range |
Volume |
Thu 23 October 2025 |
37.44 (-1.42%) |
38.14 |
37.44 - 38.14 |
0.782 times |
Wed 22 October 2025 |
37.98 (0.98%) |
37.75 |
37.48 - 38.03 |
0.6472 times |
Tue 21 October 2025 |
37.61 (-0.08%) |
37.69 |
37.52 - 37.74 |
0.6648 times |
Mon 20 October 2025 |
37.64 (0.94%) |
37.66 |
37.48 - 37.71 |
0.8936 times |
Fri 17 October 2025 |
37.29 (-0.11%) |
37.38 |
37.11 - 37.38 |
0.8578 times |
Thu 16 October 2025 |
37.33 (-1.43%) |
37.96 |
37.31 - 37.96 |
0.7184 times |
Wed 15 October 2025 |
37.87 (0.37%) |
37.83 |
37.83 - 38.25 |
1.1473 times |
Tue 14 October 2025 |
37.73 (-0.34%) |
37.51 |
37.34 - 37.76 |
0.9757 times |
Mon 13 October 2025 |
37.86 (-3.84%) |
37.84 |
37.74 - 37.96 |
1.7906 times |
Tue 07 October 2025 |
39.37 (-0.05%) |
39.34 |
39.16 - 39.37 |
1.5226 times |
Mon 06 October 2025 |
39.39 (-0.63%) |
39.79 |
39.34 - 39.79 |
0.7611 times |
Weekly price and charts AmericanEnergy Strong weekly Stock price targets for AmericanEnergy USAI are 37.09 and 37.79 | Weekly Target 1 | 36.97 | | Weekly Target 2 | 37.21 | | Weekly Target 3 | 37.673333333333 | | Weekly Target 4 | 37.91 | | Weekly Target 5 | 38.37 |
Weekly price and volumes for American Energy
| Date |
Closing |
Open |
Range |
Volume |
Thu 23 October 2025 |
37.44 (0.4%) |
37.66 |
37.44 - 38.14 |
0.5149 times |
Fri 17 October 2025 |
37.29 (-5.28%) |
37.84 |
37.11 - 38.25 |
0.9461 times |
Tue 07 October 2025 |
39.37 (-0.68%) |
39.79 |
39.16 - 39.79 |
0.3935 times |
Fri 03 October 2025 |
39.64 (-1.39%) |
40.29 |
39.34 - 40.29 |
1.9184 times |
Fri 26 September 2025 |
40.20 (2.45%) |
39.16 |
39.12 - 40.55 |
0.7927 times |
Fri 19 September 2025 |
39.24 (0.33%) |
39.17 |
38.88 - 39.84 |
1.0385 times |
Fri 12 September 2025 |
39.11 (-0.71%) |
39.25 |
38.57 - 39.33 |
2.7163 times |
Fri 05 September 2025 |
39.39 (-1.06%) |
39.67 |
39.00 - 39.84 |
0.449 times |
Fri 29 August 2025 |
39.81 (0%) |
39.82 |
39.80 - 40.00 |
0.0868 times |
Fri 29 August 2025 |
39.81 (0.33%) |
39.73 |
39.25 - 40.00 |
1.1438 times |
Fri 22 August 2025 |
39.68 (1.48%) |
39.10 |
38.69 - 39.96 |
0.8223 times |

Monthly price and charts AmericanEnergy Strong monthly Stock price targets for AmericanEnergy USAI are 35.85 and 38.71 | Monthly Target 1 | 35.31 | | Monthly Target 2 | 36.38 | | Monthly Target 3 | 38.173333333333 | | Monthly Target 4 | 39.24 | | Monthly Target 5 | 41.03 |
Monthly price and volumes American Energy
| Date |
Closing |
Open |
Range |
Volume |
Thu 23 October 2025 |
37.44 (-6.05%) |
39.66 |
37.11 - 39.97 |
0.6708 times |
Tue 30 September 2025 |
39.85 (0.1%) |
39.67 |
38.57 - 40.55 |
1.0382 times |
Fri 29 August 2025 |
39.81 (-0.67%) |
39.98 |
38.69 - 40.25 |
0.8999 times |
Thu 31 July 2025 |
40.08 (-1.55%) |
40.34 |
39.04 - 41.10 |
0.8102 times |
Mon 30 June 2025 |
40.71 (3.93%) |
39.41 |
39.17 - 40.74 |
0.4563 times |
Fri 30 May 2025 |
39.17 (2.51%) |
38.48 |
37.80 - 39.93 |
0.7774 times |
Wed 30 April 2025 |
38.21 (-7.05%) |
40.76 |
34.20 - 41.90 |
0.962 times |
Mon 31 March 2025 |
41.11 (0.64%) |
41.13 |
37.92 - 42.58 |
0.824 times |
Fri 28 February 2025 |
40.85 (-0.29%) |
40.38 |
38.95 - 42.09 |
1.2006 times |
Fri 31 January 2025 |
40.97 (2.99%) |
40.15 |
40.12 - 43.98 |
2.3605 times |
Tue 31 December 2024 |
39.78 (-3.59%) |
41.10 |
37.97 - 41.40 |
0.861 times |

DMA SMA EMA moving averages of American Energy USAI
DMA (daily moving average) of American Energy USAI
| DMA period | DMA value | | 5 day DMA | 37.59 | | 12 day DMA | 38.1 | | 20 day DMA | 38.82 | | 35 day DMA | 38.99 | | 50 day DMA | 39.13 | | 100 day DMA | 39.51 | | 150 day DMA | 39.35 | | 200 day DMA | 39.75 | EMA (exponential moving average) of American Energy USAI
| EMA period | EMA current | EMA prev | EMA prev2 | | 5 day EMA | 37.67 | 37.78 | 37.68 | | 12 day EMA | 38.06 | 38.17 | 38.21 | | 20 day EMA | 38.4 | 38.5 | 38.56 | | 35 day EMA | 38.77 | 38.85 | 38.9 | | 50 day EMA | 39.02 | 39.08 | 39.12 |
SMA (simple moving average) of American Energy USAI
| SMA period | SMA current | SMA prev | SMA prev2 | | 5 day SMA | 37.59 | 37.57 | 37.55 | | 12 day SMA | 38.1 | 38.26 | 38.4 | | 20 day SMA | 38.82 | 38.92 | 38.98 | | 35 day SMA | 38.99 | 39.06 | 39.11 | | 50 day SMA | 39.13 | 39.16 | 39.19 | | 100 day SMA | 39.51 | 39.53 | 39.54 | | 150 day SMA | 39.35 | 39.37 | 39.38 | | 200 day SMA | 39.75 | 39.77 | 39.78 |
|
|
