GX URA full analysis,charts,indicators,moving averages,SMA,DMA,EMA,ADX,MACD,RSIG X URA WideScreen charts, DMA,SMA,EMA technical analysis, forecast prediction, by indicators ADX,MACD,RSI,CCI AMEX stock exchange
Daily price and charts and targets GX Strong Daily Stock price targets for GX URA are 48.99 and 50.84 | Daily Target 1 | 47.56 | | Daily Target 2 | 48.57 | | Daily Target 3 | 49.41 | | Daily Target 4 | 50.42 | | Daily Target 5 | 51.26 |
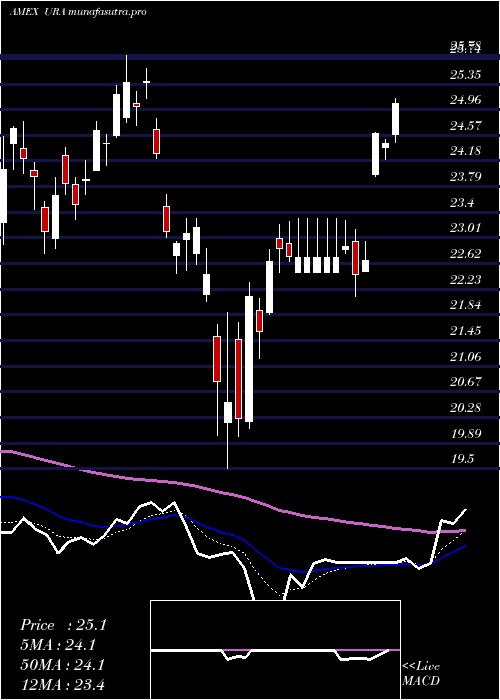
Daily price and volume G X
| Date |
Closing |
Open |
Range |
Volume |
Thu 23 October 2025 |
49.58 (1.22%) |
49.18 |
48.40 - 50.25 |
0.5182 times |
Wed 22 October 2025 |
48.98 (-1.84%) |
48.42 |
47.15 - 49.61 |
1.0712 times |
Tue 21 October 2025 |
49.90 (-6.48%) |
51.80 |
49.53 - 52.27 |
1.0251 times |
Mon 20 October 2025 |
53.36 (0.09%) |
53.97 |
51.96 - 54.85 |
0.5584 times |
Fri 17 October 2025 |
53.31 (-4.36%) |
54.00 |
51.72 - 55.68 |
1.077 times |
Thu 16 October 2025 |
55.74 (-4.08%) |
59.04 |
55.51 - 59.79 |
1.033 times |
Wed 15 October 2025 |
58.11 (2.02%) |
59.60 |
55.59 - 60.51 |
1.1609 times |
Tue 14 October 2025 |
56.96 (2.65%) |
55.15 |
53.03 - 58.53 |
1.1954 times |
Mon 13 October 2025 |
55.49 (6.98%) |
54.95 |
54.73 - 57.15 |
1.1673 times |
Fri 10 October 2025 |
51.87 (0.74%) |
51.90 |
51.51 - 55.44 |
1.1936 times |
Thu 09 October 2025 |
51.49 (0.92%) |
51.94 |
50.45 - 52.37 |
0.5542 times |
Weekly price and charts GX Strong weekly Stock price targets for GX URA are 44.52 and 52.22 | Weekly Target 1 | 42.83 | | Weekly Target 2 | 46.2 | | Weekly Target 3 | 50.526666666667 | | Weekly Target 4 | 53.9 | | Weekly Target 5 | 58.23 |
Weekly price and volumes for G X
| Date |
Closing |
Open |
Range |
Volume |
Thu 23 October 2025 |
49.58 (-7%) |
53.97 |
47.15 - 54.85 |
1.1488 times |
Fri 17 October 2025 |
53.31 (2.78%) |
54.95 |
51.72 - 60.51 |
2.0399 times |
Fri 10 October 2025 |
51.87 (4.58%) |
50.00 |
49.90 - 55.44 |
1.2875 times |
Fri 03 October 2025 |
49.60 (2.46%) |
49.49 |
47.66 - 50.65 |
0.8881 times |
Fri 26 September 2025 |
48.41 (-2.06%) |
49.22 |
46.35 - 51.39 |
1.2471 times |
Fri 19 September 2025 |
49.43 (17.55%) |
42.50 |
42.10 - 49.50 |
1.2552 times |
Fri 12 September 2025 |
42.05 (3.24%) |
41.40 |
40.78 - 43.09 |
0.6187 times |
Fri 05 September 2025 |
40.73 (0.15%) |
39.45 |
39.03 - 41.77 |
0.5372 times |
Fri 29 August 2025 |
40.67 (0%) |
41.95 |
40.33 - 42.58 |
0.1748 times |
Fri 29 August 2025 |
40.67 (3.12%) |
39.67 |
39.10 - 42.58 |
0.8027 times |
Fri 22 August 2025 |
39.44 (1.1%) |
38.88 |
35.64 - 39.58 |
0.7883 times |
Monthly price and charts GX Strong monthly Stock price targets for GX URA are 48.37 and 61.73 | Monthly Target 1 | 39.05 | | Monthly Target 2 | 44.32 | | Monthly Target 3 | 52.413333333333 | | Monthly Target 4 | 57.68 | | Monthly Target 5 | 65.77 |
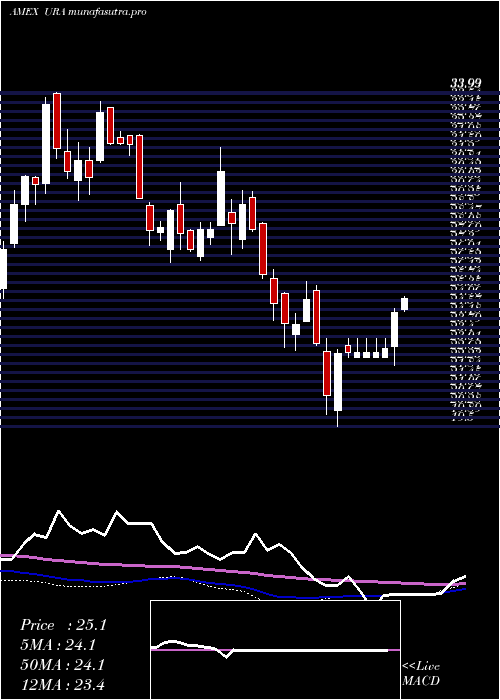
Monthly price and volumes G X
| Date |
Closing |
Open |
Range |
Volume |
Thu 23 October 2025 |
49.58 (4.01%) |
48.26 |
47.15 - 60.51 |
1.6051 times |
Tue 30 September 2025 |
47.67 (17.21%) |
39.45 |
39.03 - 51.39 |
1.2613 times |
Fri 29 August 2025 |
40.67 (3.33%) |
38.00 |
35.64 - 42.58 |
0.9916 times |
Thu 31 July 2025 |
39.36 (1.42%) |
38.35 |
36.20 - 42.22 |
0.9748 times |
Mon 30 June 2025 |
38.81 (21.24%) |
31.89 |
31.73 - 39.28 |
0.9374 times |
Fri 30 May 2025 |
32.01 (28.04%) |
25.38 |
25.07 - 33.40 |
1.0108 times |
Wed 30 April 2025 |
25.00 (9.08%) |
22.98 |
19.50 - 25.49 |
0.7639 times |
Mon 31 March 2025 |
22.92 (-7.58%) |
25.26 |
22.47 - 25.78 |
0.7614 times |
Fri 28 February 2025 |
24.80 (-12.4%) |
27.60 |
24.07 - 29.70 |
0.7306 times |
Fri 31 January 2025 |
28.31 (5.71%) |
26.98 |
26.67 - 31.60 |
0.9632 times |
Tue 31 December 2024 |
26.78 (-15.68%) |
32.09 |
26.60 - 32.15 |
0.512 times |

DMA SMA EMA moving averages of G X URA
DMA (daily moving average) of G X URA
| DMA period | DMA value | | 5 day DMA | 51.03 | | 12 day DMA | 52.98 | | 20 day DMA | 51.55 | | 35 day DMA | 48.88 | | 50 day DMA | 46.07 | | 100 day DMA | 42.11 | | 150 day DMA | 36.51 | | 200 day DMA | 34.09 | EMA (exponential moving average) of G X URA
| EMA period | EMA current | EMA prev | EMA prev2 | | 5 day EMA | 50.89 | 51.55 | 52.84 | | 12 day EMA | 51.75 | 52.15 | 52.73 | | 20 day EMA | 51.05 | 51.21 | 51.45 | | 35 day EMA | 48.75 | 48.7 | 48.68 | | 50 day EMA | 46.03 | 45.88 | 45.75 |
SMA (simple moving average) of G X URA
| SMA period | SMA current | SMA prev | SMA prev2 | | 5 day SMA | 51.03 | 52.26 | 54.08 | | 12 day SMA | 52.98 | 53.12 | 53.31 | | 20 day SMA | 51.55 | 51.53 | 51.51 | | 35 day SMA | 48.88 | 48.62 | 48.4 | | 50 day SMA | 46.07 | 45.86 | 45.67 | | 100 day SMA | 42.11 | 41.93 | 41.76 | | 150 day SMA | 36.51 | 36.35 | 36.19 | | 200 day SMA | 34.09 | 33.98 | 33.88 |
|
|
