Us12 UNL full analysis,charts,indicators,moving averages,SMA,DMA,EMA,ADX,MACD,RSIUs 12 UNL WideScreen charts, DMA,SMA,EMA technical analysis, forecast prediction, by indicators ADX,MACD,RSI,CCI AMEX stock exchange
Daily price and charts and targets Us12 Strong Daily Stock price targets for Us12 UNL are 7.81 and 7.94 | Daily Target 1 | 7.79 | | Daily Target 2 | 7.83 | | Daily Target 3 | 7.9166666666667 | | Daily Target 4 | 7.96 | | Daily Target 5 | 8.05 |
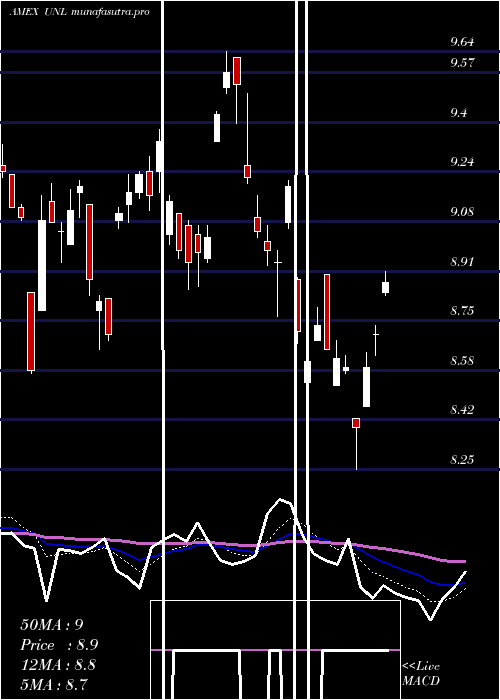
Daily price and volume Us 12
| Date |
Closing |
Open |
Range |
Volume |
Thu 23 October 2025 |
7.88 (-0.88%) |
7.94 |
7.87 - 8.00 |
1.4075 times |
Wed 22 October 2025 |
7.95 (-0.87%) |
8.05 |
7.93 - 8.05 |
0.6111 times |
Tue 21 October 2025 |
8.02 (0.88%) |
7.93 |
7.89 - 8.02 |
0.6816 times |
Mon 20 October 2025 |
7.95 (4.33%) |
7.84 |
7.83 - 7.98 |
0.8843 times |
Fri 17 October 2025 |
7.62 (2.01%) |
7.46 |
7.46 - 7.63 |
0.7067 times |
Thu 16 October 2025 |
7.47 (-1.19%) |
7.53 |
7.46 - 7.61 |
1.6902 times |
Wed 15 October 2025 |
7.56 (-0.13%) |
7.55 |
7.48 - 7.59 |
1.6765 times |
Tue 14 October 2025 |
7.57 (-1.56%) |
7.57 |
7.57 - 7.61 |
0.4826 times |
Mon 13 October 2025 |
7.69 (-6.11%) |
7.67 |
7.61 - 7.71 |
1.3837 times |
Tue 07 October 2025 |
8.19 (1.87%) |
8.11 |
8.08 - 8.19 |
0.4757 times |
Mon 06 October 2025 |
8.04 (0.5%) |
8.05 |
8.00 - 8.06 |
0.4426 times |
Weekly price and charts Us12 Strong weekly Stock price targets for Us12 UNL are 7.86 and 8.08 | Weekly Target 1 | 7.7 | | Weekly Target 2 | 7.79 | | Weekly Target 3 | 7.92 | | Weekly Target 4 | 8.01 | | Weekly Target 5 | 8.14 |
Weekly price and volumes for Us 12
| Date |
Closing |
Open |
Range |
Volume |
Thu 23 October 2025 |
7.88 (3.41%) |
7.84 |
7.83 - 8.05 |
1.163 times |
Fri 17 October 2025 |
7.62 (-6.96%) |
7.67 |
7.46 - 7.71 |
1.9272 times |
Tue 07 October 2025 |
8.19 (2.37%) |
8.05 |
8.00 - 8.19 |
0.298 times |
Fri 03 October 2025 |
8.00 (4.44%) |
7.68 |
7.67 - 8.20 |
1.326 times |
Fri 26 September 2025 |
7.66 (-0.13%) |
7.65 |
7.48 - 7.70 |
1.2779 times |
Fri 19 September 2025 |
7.67 (0.52%) |
7.64 |
7.61 - 7.90 |
1.0693 times |
Fri 12 September 2025 |
7.63 (-0.78%) |
7.83 |
7.61 - 7.83 |
0.8757 times |
Fri 05 September 2025 |
7.69 (-1.54%) |
7.72 |
7.67 - 7.87 |
0.6887 times |
Fri 29 August 2025 |
7.81 (0%) |
7.71 |
7.64 - 7.82 |
0.3176 times |
Fri 29 August 2025 |
7.81 (4.55%) |
7.40 |
7.37 - 7.82 |
1.0567 times |
Fri 22 August 2025 |
7.47 (-3.11%) |
7.66 |
7.45 - 7.72 |
1.197 times |
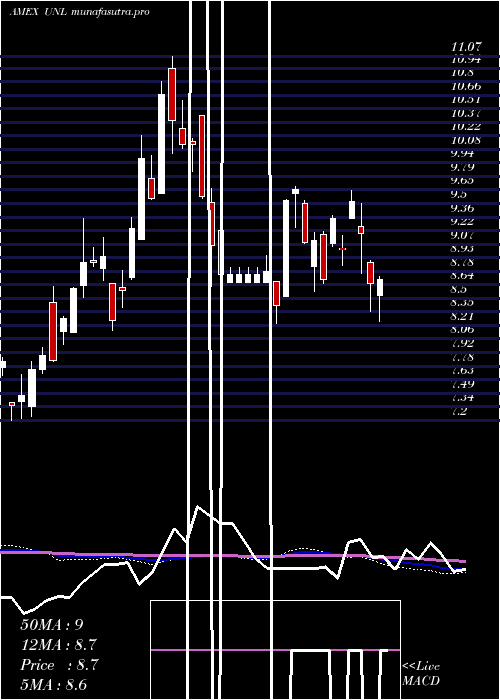
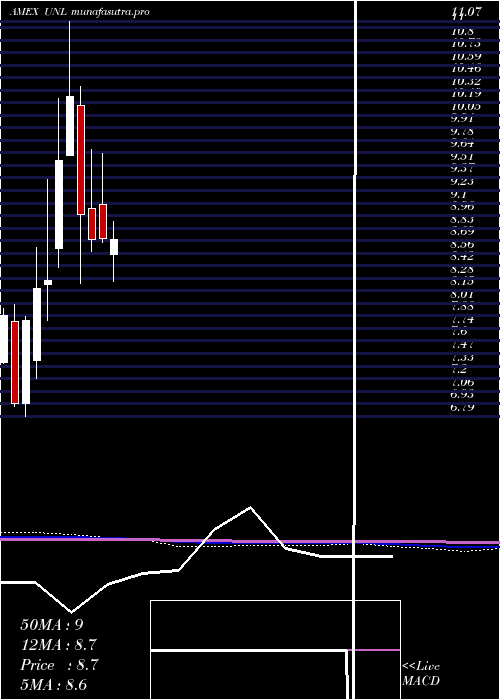
Monthly price and charts Us12 Strong monthly Stock price targets for Us12 UNL are 7.67 and 8.41 | Monthly Target 1 | 7.11 | | Monthly Target 2 | 7.49 | | Monthly Target 3 | 7.8466666666667 | | Monthly Target 4 | 8.23 | | Monthly Target 5 | 8.59 |
Monthly price and volumes Us 12
| Date |
Closing |
Open |
Range |
Volume |
Thu 23 October 2025 |
7.88 (1.16%) |
7.80 |
7.46 - 8.20 |
0.5483 times |
Tue 30 September 2025 |
7.79 (-0.26%) |
7.72 |
7.48 - 7.90 |
0.586 times |
Fri 29 August 2025 |
7.81 (-2.98%) |
8.07 |
7.37 - 8.12 |
0.5214 times |
Thu 31 July 2025 |
8.05 (-7.58%) |
8.54 |
7.90 - 9.00 |
0.6824 times |
Mon 30 June 2025 |
8.71 (0.11%) |
9.08 |
8.67 - 9.64 |
0.6795 times |
Fri 30 May 2025 |
8.70 (-3.01%) |
9.04 |
8.57 - 9.68 |
0.4969 times |
Wed 30 April 2025 |
8.97 (-12.49%) |
10.16 |
8.23 - 10.36 |
1.2188 times |
Mon 31 March 2025 |
10.25 (7.22%) |
9.61 |
9.61 - 11.07 |
2.2292 times |
Fri 28 February 2025 |
9.56 (15.74%) |
8.61 |
8.40 - 10.23 |
1.0657 times |
Fri 31 January 2025 |
8.26 (1.1%) |
8.22 |
7.83 - 9.35 |
1.9717 times |
Tue 31 December 2024 |
8.17 (4.34%) |
7.39 |
7.20 - 8.62 |
2.2788 times |
DMA SMA EMA moving averages of Us 12 UNL
DMA (daily moving average) of Us 12 UNL
| DMA period | DMA value | | 5 day DMA | 7.88 | | 12 day DMA | 7.83 | | 20 day DMA | 7.8 | | 35 day DMA | 7.77 | | 50 day DMA | 7.72 | | 100 day DMA | 8.21 | | 150 day DMA | 8.55 | | 200 day DMA | 8.75 | EMA (exponential moving average) of Us 12 UNL
| EMA period | EMA current | EMA prev | EMA prev2 | | 5 day EMA | 7.87 | 7.87 | 7.83 | | 12 day EMA | 7.83 | 7.82 | 7.8 | | 20 day EMA | 7.82 | 7.81 | 7.79 | | 35 day EMA | 7.78 | 7.77 | 7.76 | | 50 day EMA | 7.76 | 7.76 | 7.75 |
SMA (simple moving average) of Us 12 UNL
| SMA period | SMA current | SMA prev | SMA prev2 | | 5 day SMA | 7.88 | 7.8 | 7.72 | | 12 day SMA | 7.83 | 7.85 | 7.85 | | 20 day SMA | 7.8 | 7.78 | 7.77 | | 35 day SMA | 7.77 | 7.77 | 7.76 | | 50 day SMA | 7.72 | 7.72 | 7.72 | | 100 day SMA | 8.21 | 8.22 | 8.23 | | 150 day SMA | 8.55 | 8.57 | 8.58 | | 200 day SMA | 8.75 | 8.75 | 8.75 |
|
|
