UsNatural UNG full analysis,charts,indicators,moving averages,SMA,DMA,EMA,ADX,MACD,RSIUs Natural UNG WideScreen charts, DMA,SMA,EMA technical analysis, forecast prediction, by indicators ADX,MACD,RSI,CCI AMEX stock exchange
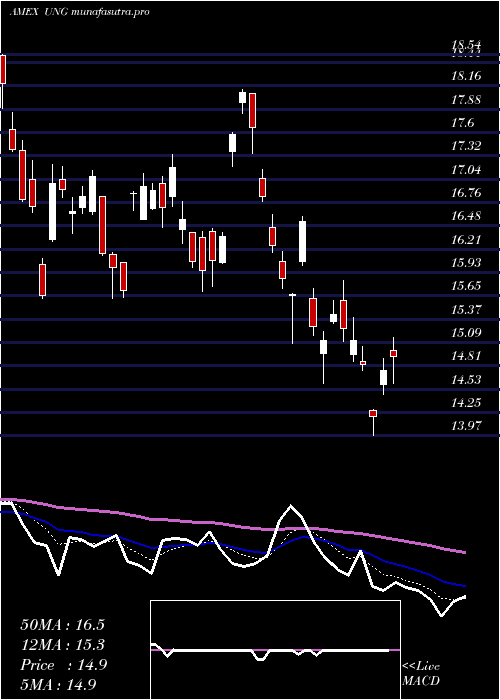
Daily price and charts and targets UsNatural Strong Daily Stock price targets for UsNatural UNG are 12.74 and 13.21 | Daily Target 1 | 12.42 | | Daily Target 2 | 12.69 | | Daily Target 3 | 12.886666666667 | | Daily Target 4 | 13.16 | | Daily Target 5 | 13.36 |
Daily price and volume Us Natural
| Date |
Closing |
Open |
Range |
Volume |
Fri 24 October 2025 |
12.97 (0.23%) |
12.97 |
12.61 - 13.08 |
0.7663 times |
Thu 23 October 2025 |
12.94 (-0.99%) |
13.13 |
12.89 - 13.28 |
0.8551 times |
Wed 22 October 2025 |
13.07 (-0.61%) |
13.00 |
12.94 - 13.31 |
0.8837 times |
Tue 21 October 2025 |
13.15 (1.54%) |
12.91 |
12.84 - 13.20 |
1.459 times |
Mon 20 October 2025 |
12.95 (9.1%) |
12.32 |
12.16 - 13.04 |
1.336 times |
Fri 17 October 2025 |
11.87 (2.5%) |
11.50 |
11.44 - 11.96 |
0.833 times |
Thu 16 October 2025 |
11.58 (-2.53%) |
11.95 |
11.54 - 12.05 |
1.1382 times |
Wed 15 October 2025 |
11.88 (-0.59%) |
11.91 |
11.69 - 11.96 |
0.8707 times |
Tue 14 October 2025 |
11.95 (-1.89%) |
11.97 |
11.81 - 12.11 |
0.8319 times |
Mon 13 October 2025 |
12.18 (-1.22%) |
12.02 |
11.93 - 12.30 |
1.026 times |
Fri 10 October 2025 |
12.33 (-3.22%) |
12.46 |
12.15 - 12.57 |
0.9791 times |
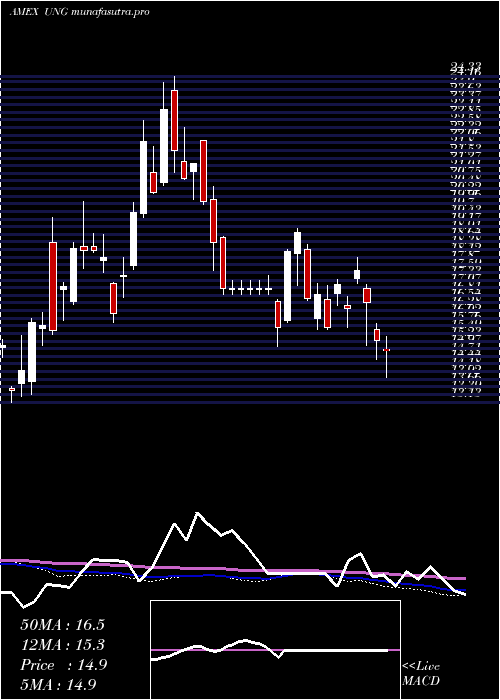
Weekly price and charts UsNatural Strong weekly Stock price targets for UsNatural UNG are 12.57 and 13.72 | Weekly Target 1 | 11.66 | | Weekly Target 2 | 12.32 | | Weekly Target 3 | 12.813333333333 | | Weekly Target 4 | 13.47 | | Weekly Target 5 | 13.96 |
Weekly price and volumes for Us Natural
| Date |
Closing |
Open |
Range |
Volume |
Fri 24 October 2025 |
12.97 (9.27%) |
12.32 |
12.16 - 13.31 |
1.6518 times |
Fri 17 October 2025 |
11.87 (-3.73%) |
12.02 |
11.44 - 12.30 |
1.4647 times |
Fri 10 October 2025 |
12.33 (-5.52%) |
13.66 |
12.15 - 13.84 |
1.2994 times |
Fri 03 October 2025 |
13.05 (4.65%) |
12.50 |
12.49 - 14.07 |
1.1628 times |
Fri 26 September 2025 |
12.47 (-0.8%) |
12.49 |
12.06 - 12.80 |
0.8754 times |
Fri 19 September 2025 |
12.57 (0.48%) |
12.62 |
12.48 - 13.43 |
0.7775 times |
Fri 12 September 2025 |
12.51 (-3.32%) |
13.41 |
12.39 - 13.46 |
0.7667 times |
Fri 05 September 2025 |
12.94 (0.86%) |
12.45 |
12.30 - 13.31 |
0.7705 times |
Fri 29 August 2025 |
12.83 (0%) |
12.65 |
12.43 - 12.85 |
0.2236 times |
Fri 29 August 2025 |
12.83 (7.72%) |
11.75 |
11.72 - 12.85 |
1.0075 times |
Fri 22 August 2025 |
11.91 (-7.17%) |
12.59 |
11.84 - 12.85 |
0.956 times |
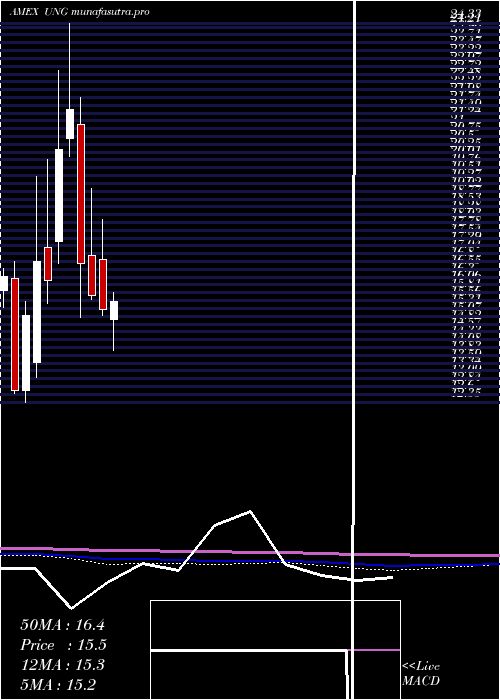
Monthly price and charts UsNatural Strong monthly Stock price targets for UsNatural UNG are 10.89 and 13.52 | Monthly Target 1 | 10.2 | | Monthly Target 2 | 11.58 | | Monthly Target 3 | 12.826666666667 | | Monthly Target 4 | 14.21 | | Monthly Target 5 | 15.46 |
Monthly price and volumes Us Natural
| Date |
Closing |
Open |
Range |
Volume |
Fri 24 October 2025 |
12.97 (-0.77%) |
13.16 |
11.44 - 14.07 |
1.4479 times |
Tue 30 September 2025 |
13.07 (1.87%) |
12.45 |
12.06 - 13.46 |
0.9992 times |
Fri 29 August 2025 |
12.83 (-5.59%) |
13.58 |
11.72 - 13.85 |
1.0469 times |
Thu 31 July 2025 |
13.59 (-11.06%) |
14.95 |
13.08 - 16.01 |
1.1115 times |
Mon 30 June 2025 |
15.28 (-2.74%) |
16.87 |
15.08 - 18.12 |
0.737 times |
Fri 30 May 2025 |
15.71 (-6.15%) |
16.98 |
15.61 - 19.11 |
0.83 times |
Wed 30 April 2025 |
16.74 (-22.54%) |
21.12 |
15.04 - 21.98 |
0.7689 times |
Mon 31 March 2025 |
21.61 (6.24%) |
20.69 |
20.12 - 24.33 |
0.7851 times |
Fri 28 February 2025 |
20.34 (25.63%) |
17.44 |
16.73 - 22.84 |
0.8555 times |
Fri 31 January 2025 |
16.19 (-3.69%) |
17.23 |
15.46 - 20.03 |
1.418 times |
Tue 31 December 2024 |
16.81 (11.47%) |
13.60 |
13.13 - 19.48 |
1.0009 times |
DMA SMA EMA moving averages of Us Natural UNG
DMA (daily moving average) of Us Natural UNG
| DMA period | DMA value | | 5 day DMA | 13.02 | | 12 day DMA | 12.47 | | 20 day DMA | 12.79 | | 35 day DMA | 12.76 | | 50 day DMA | 12.68 | | 100 day DMA | 13.85 | | 150 day DMA | 15.15 | | 200 day DMA | 16.34 | EMA (exponential moving average) of Us Natural UNG
| EMA period | EMA current | EMA prev | EMA prev2 | | 5 day EMA | 12.86 | 12.81 | 12.74 | | 12 day EMA | 12.72 | 12.67 | 12.62 | | 20 day EMA | 12.7 | 12.67 | 12.64 | | 35 day EMA | 12.69 | 12.67 | 12.65 | | 50 day EMA | 12.71 | 12.7 | 12.69 |
SMA (simple moving average) of Us Natural UNG
| SMA period | SMA current | SMA prev | SMA prev2 | | 5 day SMA | 13.02 | 12.8 | 12.52 | | 12 day SMA | 12.47 | 12.48 | 12.55 | | 20 day SMA | 12.79 | 12.77 | 12.75 | | 35 day SMA | 12.76 | 12.75 | 12.76 | | 50 day SMA | 12.68 | 12.68 | 12.67 | | 100 day SMA | 13.85 | 13.89 | 13.92 | | 150 day SMA | 15.15 | 15.2 | 15.25 | | 200 day SMA | 16.34 | 16.37 | 16.39 |
|
|
