UsGasoline UGA full analysis,charts,indicators,moving averages,SMA,DMA,EMA,ADX,MACD,RSIUs Gasoline UGA WideScreen charts, DMA,SMA,EMA technical analysis, forecast prediction, by indicators ADX,MACD,RSI,CCI AMEX stock exchange
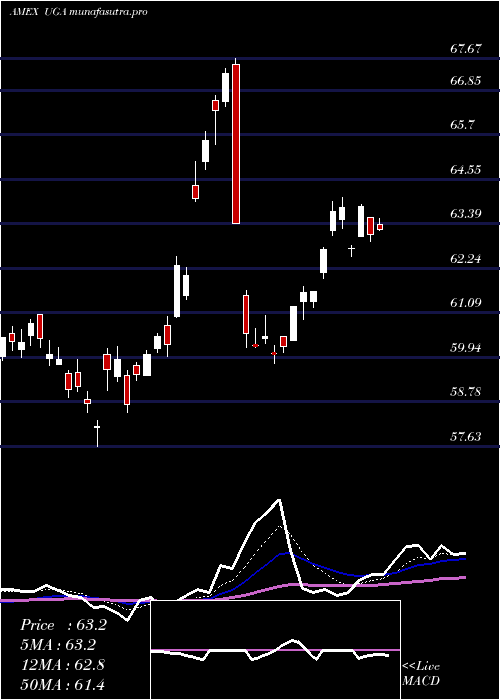
Daily price and charts and targets UsGasoline Strong Daily Stock price targets for UsGasoline UGA are 64.36 and 65.17 | Daily Target 1 | 63.76 | | Daily Target 2 | 64.14 | | Daily Target 3 | 64.57 | | Daily Target 4 | 64.95 | | Daily Target 5 | 65.38 |
Daily price and volume Us Gasoline
| Date |
Closing |
Open |
Range |
Volume |
Thu 23 October 2025 |
64.52 (2.12%) |
64.30 |
64.19 - 65.00 |
1.1375 times |
Wed 22 October 2025 |
63.18 (3.05%) |
62.33 |
62.32 - 63.46 |
1.8425 times |
Tue 21 October 2025 |
61.31 (-0.13%) |
60.94 |
60.54 - 61.77 |
0.7591 times |
Mon 20 October 2025 |
61.39 (-0.1%) |
61.17 |
60.93 - 61.39 |
0.86 times |
Fri 17 October 2025 |
61.45 (0.94%) |
60.25 |
60.25 - 61.45 |
0.4388 times |
Thu 16 October 2025 |
60.88 (-1.22%) |
61.25 |
57.46 - 61.63 |
0.4628 times |
Wed 15 October 2025 |
61.63 (1%) |
61.49 |
61.25 - 61.65 |
0.266 times |
Tue 14 October 2025 |
61.02 (-1.44%) |
61.18 |
60.57 - 61.33 |
1.3575 times |
Mon 13 October 2025 |
61.91 (1.66%) |
61.52 |
61.46 - 62.04 |
0.9364 times |
Fri 10 October 2025 |
60.90 (-3.1%) |
61.71 |
60.69 - 62.16 |
1.9393 times |
Thu 09 October 2025 |
62.85 (-1.52%) |
63.84 |
62.75 - 63.92 |
1.4296 times |
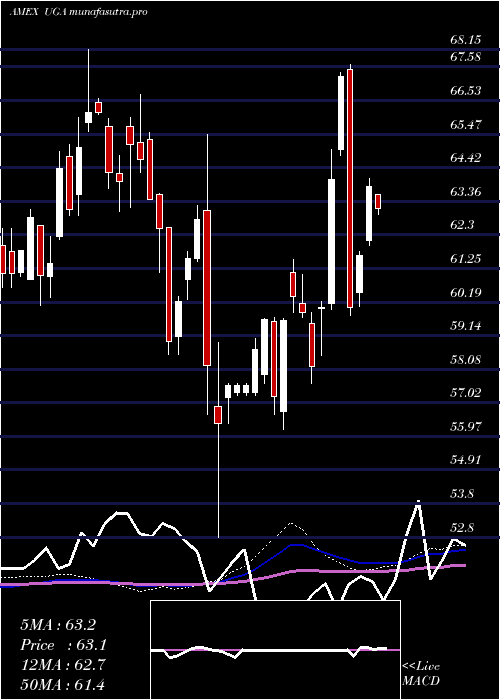
Weekly price and charts UsGasoline Strong weekly Stock price targets for UsGasoline UGA are 62.53 and 66.99 | Weekly Target 1 | 58.89 | | Weekly Target 2 | 61.71 | | Weekly Target 3 | 63.353333333333 | | Weekly Target 4 | 66.17 | | Weekly Target 5 | 67.81 |
Weekly price and volumes for Us Gasoline
| Date |
Closing |
Open |
Range |
Volume |
Thu 23 October 2025 |
64.52 (5%) |
61.17 |
60.54 - 65.00 |
0.6346 times |
Fri 17 October 2025 |
61.45 (0.9%) |
61.52 |
57.46 - 62.04 |
0.4777 times |
Fri 10 October 2025 |
60.90 (-2.14%) |
62.51 |
60.69 - 64.10 |
1.0653 times |
Fri 03 October 2025 |
62.23 (-6.01%) |
65.44 |
61.66 - 65.51 |
5.5416 times |
Fri 26 September 2025 |
66.21 (3.55%) |
63.47 |
63.46 - 66.94 |
0.2454 times |
Fri 19 September 2025 |
63.94 (-0.64%) |
65.28 |
63.84 - 66.25 |
0.3318 times |
Fri 12 September 2025 |
64.35 (0.91%) |
64.10 |
63.34 - 65.24 |
0.3158 times |
Fri 05 September 2025 |
63.77 (0.31%) |
65.47 |
63.15 - 66.25 |
1.0139 times |
Fri 29 August 2025 |
63.57 (0%) |
64.34 |
63.50 - 64.34 |
0.0864 times |
Fri 29 August 2025 |
63.57 (-1.41%) |
64.39 |
62.95 - 64.86 |
0.2875 times |
Fri 22 August 2025 |
64.48 (4.07%) |
61.69 |
61.24 - 64.54 |
0.3227 times |
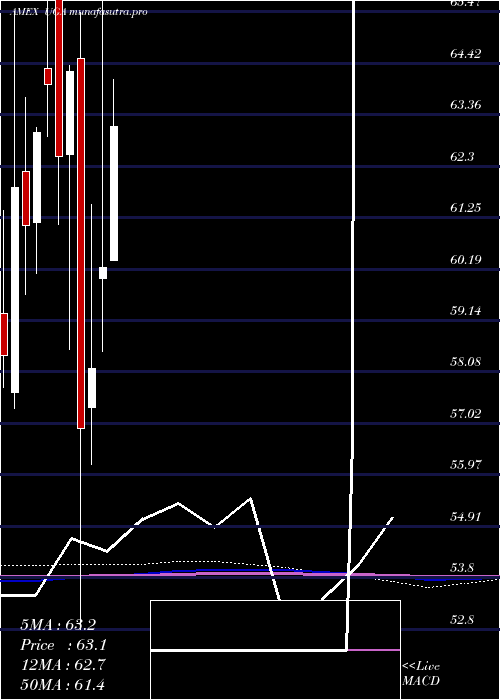
Monthly price and charts UsGasoline Strong monthly Stock price targets for UsGasoline UGA are 60.99 and 68.53 | Monthly Target 1 | 54.79 | | Monthly Target 2 | 59.65 | | Monthly Target 3 | 62.326666666667 | | Monthly Target 4 | 67.19 | | Monthly Target 5 | 69.87 |
Monthly price and volumes Us Gasoline
| Date |
Closing |
Open |
Range |
Volume |
Thu 23 October 2025 |
64.52 (0.05%) |
63.11 |
57.46 - 65.00 |
1.7027 times |
Tue 30 September 2025 |
64.49 (1.45%) |
65.47 |
63.15 - 66.94 |
0.6341 times |
Fri 29 August 2025 |
63.57 (-1.27%) |
63.98 |
61.21 - 64.86 |
0.3723 times |
Thu 31 July 2025 |
64.39 (6.92%) |
60.38 |
60.38 - 65.71 |
0.8429 times |
Mon 30 June 2025 |
60.22 (3.56%) |
60.00 |
58.50 - 67.67 |
0.7692 times |
Fri 30 May 2025 |
58.15 (2.16%) |
57.35 |
56.18 - 61.52 |
0.6203 times |
Wed 30 April 2025 |
56.92 (-11.41%) |
64.51 |
52.80 - 65.46 |
1.2807 times |
Mon 31 March 2025 |
64.25 (2.78%) |
62.55 |
58.54 - 64.38 |
0.5891 times |
Fri 28 February 2025 |
62.51 (-2.31%) |
65.72 |
61.11 - 66.73 |
1.2629 times |
Fri 31 January 2025 |
63.99 (1.59%) |
64.31 |
62.92 - 68.15 |
1.9258 times |
Tue 31 December 2024 |
62.99 (3.11%) |
61.14 |
60.10 - 63.10 |
0.8822 times |
DMA SMA EMA moving averages of Us Gasoline UGA
DMA (daily moving average) of Us Gasoline UGA
| DMA period | DMA value | | 5 day DMA | 62.37 | | 12 day DMA | 62.07 | | 20 day DMA | 62.75 | | 35 day DMA | 63.61 | | 50 day DMA | 63.68 | | 100 day DMA | 62.96 | | 150 day DMA | 61.73 | | 200 day DMA | 62.15 | EMA (exponential moving average) of Us Gasoline UGA
| EMA period | EMA current | EMA prev | EMA prev2 | | 5 day EMA | 62.83 | 61.99 | 61.4 | | 12 day EMA | 62.51 | 62.14 | 61.95 | | 20 day EMA | 62.74 | 62.55 | 62.48 | | 35 day EMA | 62.99 | 62.9 | 62.88 | | 50 day EMA | 63.42 | 63.38 | 63.39 |
SMA (simple moving average) of Us Gasoline UGA
| SMA period | SMA current | SMA prev | SMA prev2 | | 5 day SMA | 62.37 | 61.64 | 61.33 | | 12 day SMA | 62.07 | 62 | 62.04 | | 20 day SMA | 62.75 | 62.8 | 62.91 | | 35 day SMA | 63.61 | 63.62 | 63.67 | | 50 day SMA | 63.68 | 63.64 | 63.62 | | 100 day SMA | 62.96 | 62.89 | 62.85 | | 150 day SMA | 61.73 | 61.71 | 61.69 | | 200 day SMA | 62.15 | 62.14 | 62.14 |
|
|
