EtracsUbs UCIB full analysis,charts,indicators,moving averages,SMA,DMA,EMA,ADX,MACD,RSIEtracs Ubs UCIB WideScreen charts, DMA,SMA,EMA technical analysis, forecast prediction, by indicators ADX,MACD,RSI,CCI AMEX stock exchange
Daily price and charts and targets EtracsUbs Strong Daily Stock price targets for EtracsUbs UCIB are 27.44 and 27.44 | Daily Target 1 | 27.44 | | Daily Target 2 | 27.44 | | Daily Target 3 | 27.44 | | Daily Target 4 | 27.44 | | Daily Target 5 | 27.44 |
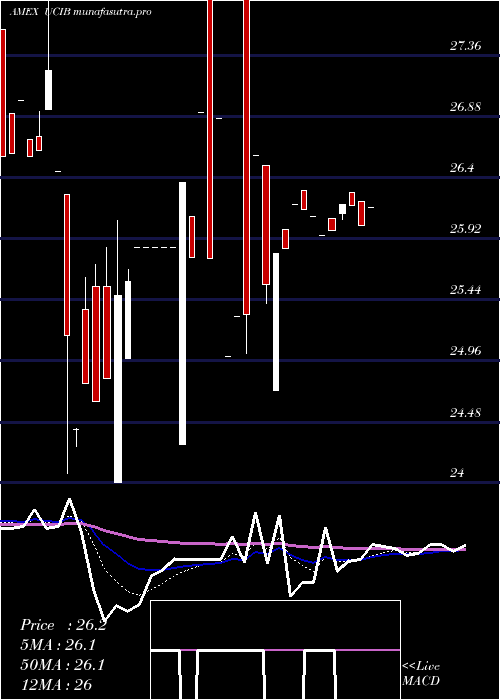
Daily price and volume Etracs Ubs
| Date |
Closing |
Open |
Range |
Volume |
Thu 23 October 2025 |
27.44 (1.4%) |
27.44 |
27.44 - 27.44 |
0.2326 times |
Wed 22 October 2025 |
27.06 (0.59%) |
27.06 |
27.06 - 27.06 |
0.4651 times |
Tue 21 October 2025 |
26.90 (-0.63%) |
26.83 |
26.83 - 26.90 |
0.4651 times |
Mon 20 October 2025 |
27.07 (0.63%) |
27.04 |
26.84 - 27.16 |
4.4186 times |
Fri 17 October 2025 |
26.90 (-0.26%) |
26.73 |
26.73 - 26.97 |
0.4651 times |
Thu 16 October 2025 |
26.97 (0.19%) |
26.96 |
26.96 - 26.97 |
0.6977 times |
Wed 15 October 2025 |
26.92 (0.11%) |
26.97 |
26.92 - 26.97 |
0.9302 times |
Tue 14 October 2025 |
26.89 (-0.37%) |
26.93 |
26.89 - 26.93 |
0.4651 times |
Mon 13 October 2025 |
26.99 (-1.6%) |
26.96 |
26.94 - 27.05 |
1.6279 times |
Tue 07 October 2025 |
27.43 (0.15%) |
27.22 |
27.22 - 27.43 |
0.2326 times |
Mon 06 October 2025 |
27.39 (0.62%) |
27.51 |
27.39 - 27.52 |
2.5349 times |
Weekly price and charts EtracsUbs Strong weekly Stock price targets for EtracsUbs UCIB are 27.14 and 27.75 | Weekly Target 1 | 26.63 | | Weekly Target 2 | 27.03 | | Weekly Target 3 | 27.236666666667 | | Weekly Target 4 | 27.64 | | Weekly Target 5 | 27.85 |
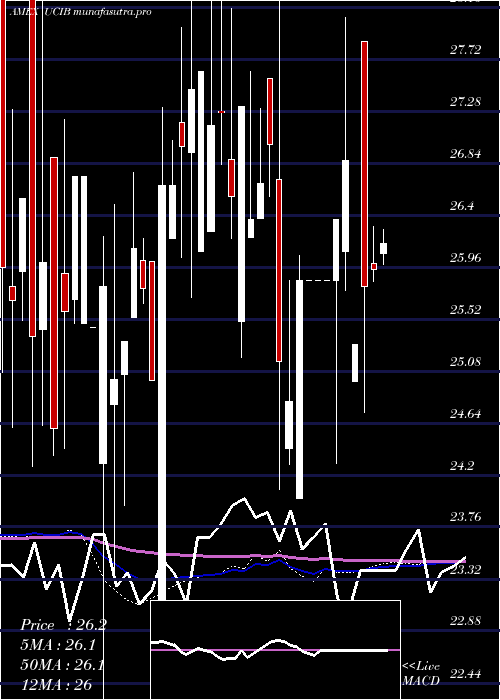
Weekly price and volumes for Etracs Ubs
| Date |
Closing |
Open |
Range |
Volume |
Thu 23 October 2025 |
27.44 (2.01%) |
27.04 |
26.83 - 27.44 |
0.1118 times |
Fri 17 October 2025 |
26.90 (-1.93%) |
26.96 |
26.73 - 27.05 |
0.0838 times |
Tue 07 October 2025 |
27.43 (0.77%) |
27.51 |
27.22 - 27.52 |
0.0554 times |
Fri 03 October 2025 |
27.22 (-0.4%) |
27.28 |
27.01 - 27.28 |
0.1029 times |
Fri 26 September 2025 |
27.33 (1.56%) |
26.86 |
26.80 - 27.33 |
0.0326 times |
Fri 19 September 2025 |
26.91 (-0.7%) |
27.35 |
26.91 - 27.62 |
9.1384 times |
Fri 12 September 2025 |
27.10 (1.31%) |
26.98 |
26.88 - 27.20 |
0.1584 times |
Fri 05 September 2025 |
26.75 (-0.89%) |
27.21 |
24.92 - 27.34 |
0.2003 times |
Fri 29 August 2025 |
26.99 (0%) |
26.87 |
26.76 - 27.00 |
0.0466 times |
Fri 29 August 2025 |
26.99 (0.71%) |
26.81 |
26.74 - 27.00 |
0.0699 times |
Fri 22 August 2025 |
26.80 (1.36%) |
26.45 |
26.20 - 26.80 |
0.2422 times |
Monthly price and charts EtracsUbs Strong monthly Stock price targets for EtracsUbs UCIB are 27.09 and 27.88 | Monthly Target 1 | 26.44 | | Monthly Target 2 | 26.94 | | Monthly Target 3 | 27.23 | | Monthly Target 4 | 27.73 | | Monthly Target 5 | 28.02 |
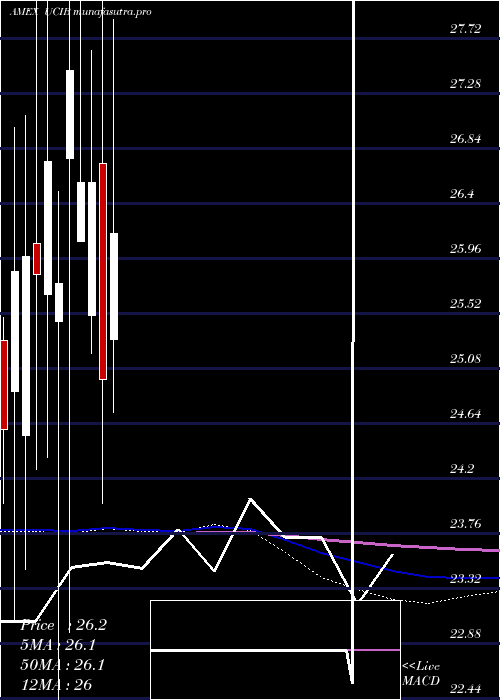
Monthly price and volumes Etracs Ubs
| Date |
Closing |
Open |
Range |
Volume |
Thu 23 October 2025 |
27.44 (0.99%) |
27.03 |
26.73 - 27.52 |
0.1867 times |
Tue 30 September 2025 |
27.17 (0.67%) |
27.21 |
24.92 - 27.62 |
5.0956 times |
Fri 29 August 2025 |
26.99 (1.62%) |
26.21 |
26.20 - 27.00 |
0.2838 times |
Thu 31 July 2025 |
26.56 (0.76%) |
26.34 |
26.30 - 27.20 |
0.719 times |
Mon 30 June 2025 |
26.36 (3.01%) |
26.00 |
24.18 - 27.88 |
1.1288 times |
Fri 30 May 2025 |
25.59 (2.4%) |
25.31 |
24.73 - 27.87 |
0.5228 times |
Wed 30 April 2025 |
24.99 (-5.91%) |
26.72 |
24.00 - 28.25 |
0.5932 times |
Mon 31 March 2025 |
26.56 (0%) |
25.50 |
25.20 - 27.62 |
0.3038 times |
Thu 27 February 2025 |
26.56 (-3.28%) |
26.09 |
26.09 - 28.72 |
0.57 times |
Fri 31 January 2025 |
27.46 (6.6%) |
26.76 |
22.97 - 28.26 |
0.5963 times |
Tue 31 December 2024 |
25.76 (-3.63%) |
25.45 |
22.00 - 26.49 |
0.8211 times |
DMA SMA EMA moving averages of Etracs Ubs UCIB
DMA (daily moving average) of Etracs Ubs UCIB
| DMA period | DMA value | | 5 day DMA | 27.07 | | 12 day DMA | 27.1 | | 20 day DMA | 27.14 | | 35 day DMA | 27.1 | | 50 day DMA | 26.97 | | 100 day DMA | 26.77 | | 150 day DMA | 26.54 | | 200 day DMA | 26.54 | EMA (exponential moving average) of Etracs Ubs UCIB
| EMA period | EMA current | EMA prev | EMA prev2 | | 5 day EMA | 27.15 | 27 | 26.97 | | 12 day EMA | 27.1 | 27.04 | 27.04 | | 20 day EMA | 27.08 | 27.04 | 27.04 | | 35 day EMA | 27.01 | 26.98 | 26.98 | | 50 day EMA | 26.93 | 26.91 | 26.9 |
SMA (simple moving average) of Etracs Ubs UCIB
| SMA period | SMA current | SMA prev | SMA prev2 | | 5 day SMA | 27.07 | 26.98 | 26.95 | | 12 day SMA | 27.1 | 27.07 | 27.08 | | 20 day SMA | 27.14 | 27.11 | 27.1 | | 35 day SMA | 27.1 | 27.08 | 27.08 | | 50 day SMA | 26.97 | 26.95 | 26.93 | | 100 day SMA | 26.77 | 26.75 | 26.74 | | 150 day SMA | 26.54 | 26.53 | 26.53 | | 200 day SMA | 26.54 | 26.53 | 26.52 |
|
|
