Ultra20 UBT full analysis,charts,indicators,moving averages,SMA,DMA,EMA,ADX,MACD,RSIUltra 20 UBT WideScreen charts, DMA,SMA,EMA technical analysis, forecast prediction, by indicators ADX,MACD,RSI,CCI AMEX stock exchange
Daily price and charts and targets Ultra20 Strong Daily Stock price targets for Ultra20 UBT are 18.05 and 18.26 | Daily Target 1 | 18 | | Daily Target 2 | 18.09 | | Daily Target 3 | 18.213333333333 | | Daily Target 4 | 18.3 | | Daily Target 5 | 18.42 |
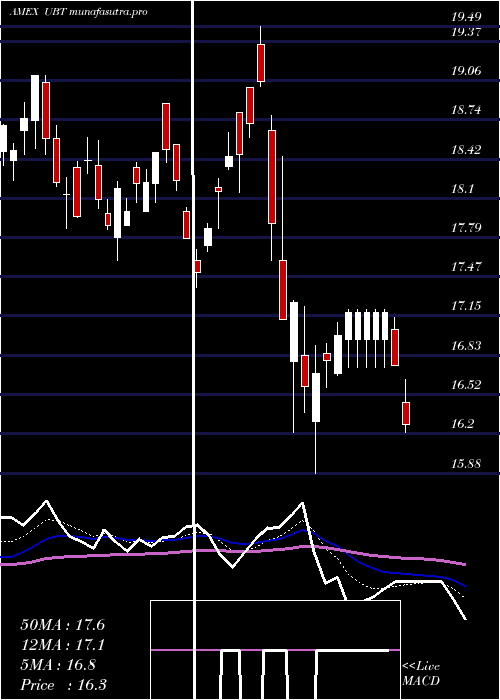
Daily price and volume Ultra 20
| Date |
Closing |
Open |
Range |
Volume |
Thu 23 October 2025 |
18.17 (-1.46%) |
18.22 |
18.13 - 18.34 |
0.4579 times |
Wed 22 October 2025 |
18.44 (0.22%) |
18.40 |
18.34 - 18.48 |
0.4372 times |
Tue 21 October 2025 |
18.40 (0.88%) |
18.43 |
18.39 - 18.47 |
0.6139 times |
Mon 20 October 2025 |
18.24 (0.72%) |
17.73 |
17.73 - 18.24 |
0.8226 times |
Fri 17 October 2025 |
18.11 (-0.44%) |
18.37 |
17.98 - 18.37 |
0.3995 times |
Thu 16 October 2025 |
18.19 (1.73%) |
17.87 |
17.82 - 18.22 |
0.6994 times |
Wed 15 October 2025 |
17.88 (-0.5%) |
18.05 |
17.83 - 18.16 |
0.8156 times |
Tue 14 October 2025 |
17.97 (0.56%) |
17.92 |
17.84 - 17.99 |
1.7029 times |
Mon 13 October 2025 |
17.87 (0%) |
17.75 |
17.63 - 17.87 |
0.9772 times |
Fri 10 October 2025 |
17.87 (3.29%) |
17.63 |
17.62 - 17.92 |
3.0738 times |
Thu 09 October 2025 |
17.30 (-0.63%) |
17.36 |
17.28 - 17.38 |
0.8829 times |
Weekly price and charts Ultra20 Strong weekly Stock price targets for Ultra20 UBT are 17.95 and 18.7 | Weekly Target 1 | 17.38 | | Weekly Target 2 | 17.77 | | Weekly Target 3 | 18.126666666667 | | Weekly Target 4 | 18.52 | | Weekly Target 5 | 18.88 |
Weekly price and volumes for Ultra 20
| Date |
Closing |
Open |
Range |
Volume |
Thu 23 October 2025 |
18.17 (0.33%) |
17.73 |
17.73 - 18.48 |
0.2752 times |
Fri 17 October 2025 |
18.11 (1.34%) |
17.75 |
17.63 - 18.37 |
0.5424 times |
Fri 10 October 2025 |
17.87 (2.82%) |
17.21 |
16.93 - 17.92 |
0.8361 times |
Fri 03 October 2025 |
17.38 (1.58%) |
17.29 |
17.26 - 17.58 |
0.6139 times |
Fri 26 September 2025 |
17.11 (-1.67%) |
17.33 |
17.00 - 17.52 |
0.3051 times |
Fri 19 September 2025 |
17.40 (-1.97%) |
17.84 |
17.30 - 18.18 |
0.7047 times |
Fri 12 September 2025 |
17.75 (3.14%) |
17.47 |
17.42 - 17.97 |
0.8705 times |
Fri 05 September 2025 |
17.21 (5.32%) |
16.11 |
16.10 - 17.26 |
0.6225 times |
Fri 29 August 2025 |
16.34 (0%) |
16.44 |
16.34 - 16.47 |
2.1614 times |
Fri 29 August 2025 |
16.34 (-1.45%) |
16.47 |
16.16 - 16.65 |
3.0679 times |
Fri 22 August 2025 |
16.58 (1.22%) |
16.37 |
16.20 - 16.67 |
1.0187 times |
Monthly price and charts Ultra20 Strong monthly Stock price targets for Ultra20 UBT are 17.55 and 19.1 | Monthly Target 1 | 16.31 | | Monthly Target 2 | 17.24 | | Monthly Target 3 | 17.86 | | Monthly Target 4 | 18.79 | | Monthly Target 5 | 19.41 |
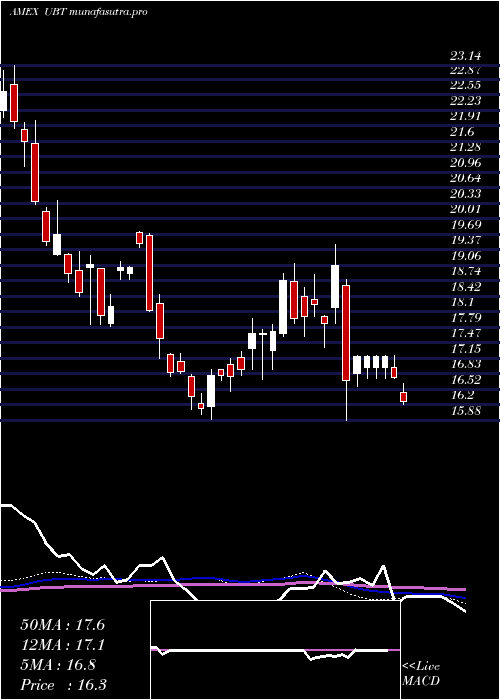
Monthly price and volumes Ultra 20
| Date |
Closing |
Open |
Range |
Volume |
Thu 23 October 2025 |
18.17 (5.21%) |
17.48 |
16.93 - 18.48 |
0.303 times |
Tue 30 September 2025 |
17.27 (5.69%) |
16.11 |
16.10 - 18.18 |
0.4414 times |
Fri 29 August 2025 |
16.34 (-0.61%) |
16.84 |
16.16 - 17.17 |
1.2652 times |
Thu 31 July 2025 |
16.44 (-2.66%) |
16.92 |
15.50 - 17.06 |
1.4547 times |
Mon 30 June 2025 |
16.89 (3.62%) |
16.08 |
15.89 - 17.00 |
0.7699 times |
Fri 30 May 2025 |
16.30 (-7.07%) |
17.66 |
15.25 - 17.69 |
1.4059 times |
Wed 30 April 2025 |
17.54 (-3.41%) |
18.36 |
15.88 - 19.49 |
2.578 times |
Mon 31 March 2025 |
18.16 (-3.15%) |
18.73 |
17.38 - 19.10 |
0.4854 times |
Fri 28 February 2025 |
18.75 (10.75%) |
17.35 |
16.72 - 18.88 |
0.5717 times |
Fri 31 January 2025 |
16.93 (0.18%) |
17.08 |
15.90 - 17.30 |
0.7247 times |
Tue 31 December 2024 |
16.90 (-11.15%) |
19.72 |
16.78 - 19.75 |
0.5343 times |

DMA SMA EMA moving averages of Ultra 20 UBT
DMA (daily moving average) of Ultra 20 UBT
| DMA period | DMA value | | 5 day DMA | 18.27 | | 12 day DMA | 17.99 | | 20 day DMA | 17.72 | | 35 day DMA | 17.65 | | 50 day DMA | 17.29 | | 100 day DMA | 16.87 | | 150 day DMA | 16.91 | | 200 day DMA | 17.07 | EMA (exponential moving average) of Ultra 20 UBT
| EMA period | EMA current | EMA prev | EMA prev2 | | 5 day EMA | 18.24 | 18.27 | 18.18 | | 12 day EMA | 18.03 | 18 | 17.92 | | 20 day EMA | 17.85 | 17.82 | 17.75 | | 35 day EMA | 17.57 | 17.53 | 17.48 | | 50 day EMA | 17.34 | 17.31 | 17.26 |
SMA (simple moving average) of Ultra 20 UBT
| SMA period | SMA current | SMA prev | SMA prev2 | | 5 day SMA | 18.27 | 18.28 | 18.16 | | 12 day SMA | 17.99 | 17.92 | 17.81 | | 20 day SMA | 17.72 | 17.67 | 17.61 | | 35 day SMA | 17.65 | 17.61 | 17.56 | | 50 day SMA | 17.29 | 17.26 | 17.23 | | 100 day SMA | 16.87 | 16.85 | 16.83 | | 150 day SMA | 16.91 | 16.91 | 16.91 | | 200 day SMA | 17.07 | 17.06 | 17.05 |
|
|
